
Cervical & Neural Pathologies
The Association of Vascular Health with Cervical Paraspinal Muscle Atrophy and Disc Degeneration
- Hospital for Special Surgery Main Hospital, New York, United States of America
Abstract
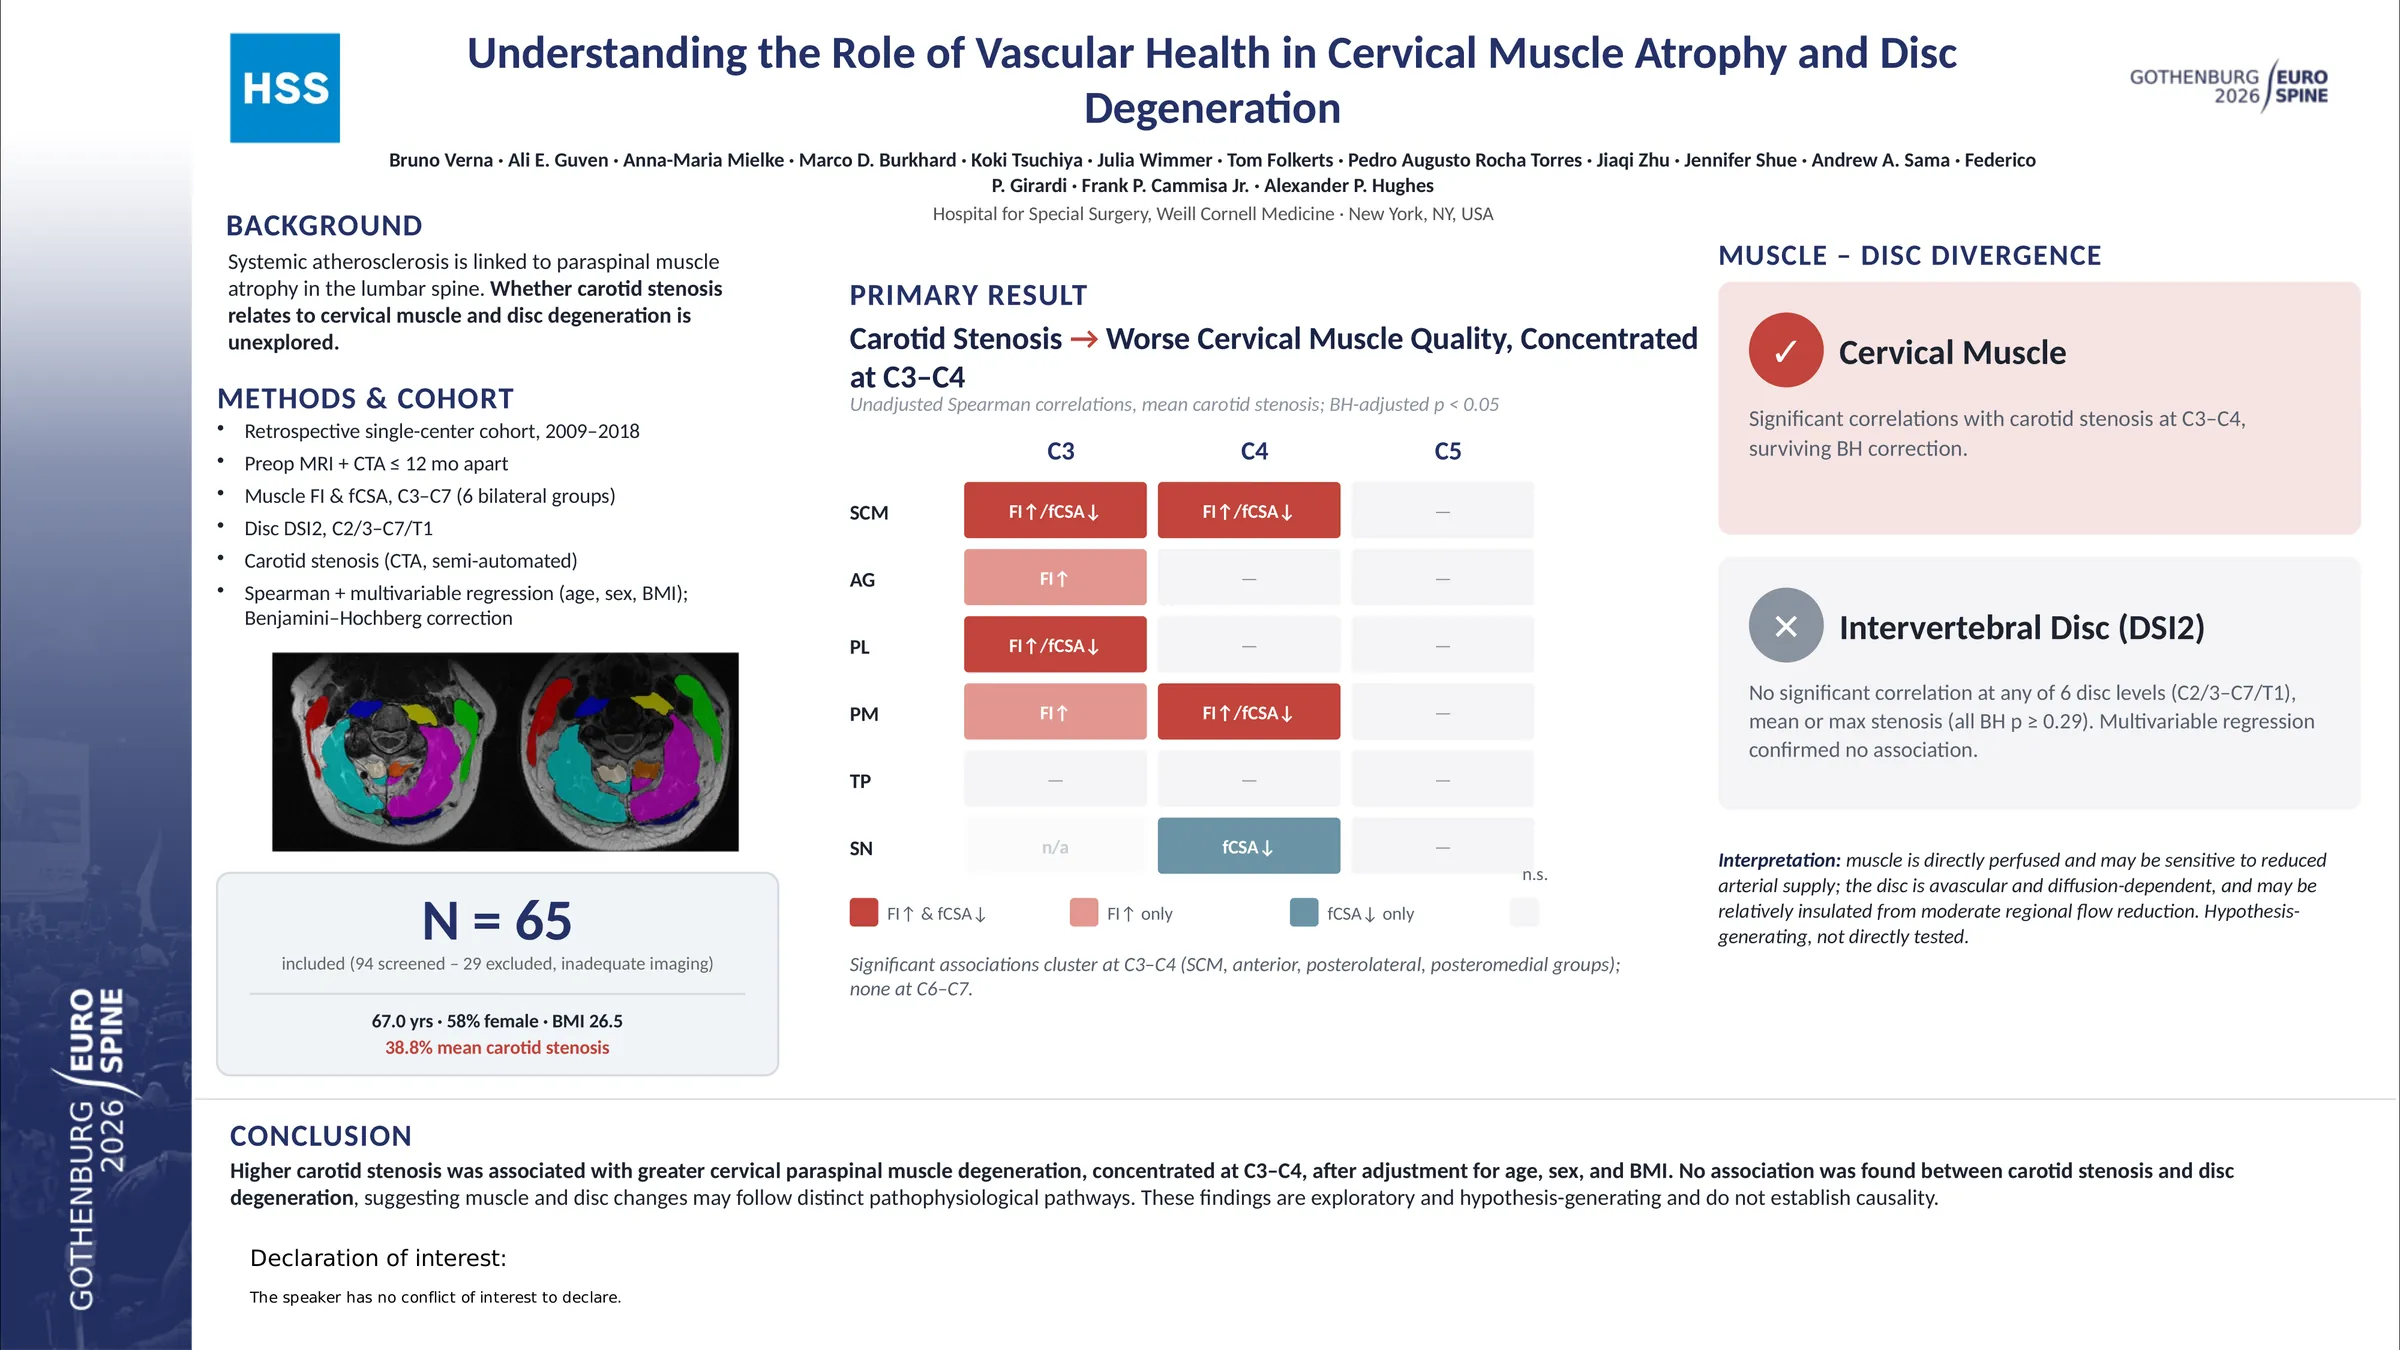
Degeneration of paraspinal muscles and intervertebral discs has been associated with spine instability, chronic pain, and suboptimal surgical outcomes. While vascular influences on lumbar degeneration are known, cervical associations remain unclear. The objective of our study is to evaluate the relationship between carotid artery stenosis (CAS) and cervical paraspinal muscle atrophy as well as its association with intervertebral disc integrity.
Patients undergoing primary cervical spine surgery between 2009 and 2018 with preoperative cervical MRI and CTA exams (≤12 months apart) were included. MRIs from C3 to C7 were used to measure fatty infiltration (FI) and functional cross-sectional area (fCSA) in six muscle groups: sternocleidomastoid (SCM), anterior group (AG), scalenus (SN), posteromedial (PM), posterolateral (PL), and trapezius (TP). Disc degeneration was evaluated using a validated Disc Signal Intensity (DSI2) Score. CAS was measured on CTA using a semi-automated software that calculated both the maximum and mean percentage of stenosis.
Sixty-five patients were included. In multivariable linear regression models, higher mean stenosis was significantly associated with increased FI in the SCM, PL, PM, TP, and AG at C3, as well as the PM at C4 and SCM at C5 (all p < 0.05). It was also associated with reduced fCSA in the PM and SCM at C4 (both p < 0.05). Similarly, higher maximum stenosis was significantly associated with increased FI in the SCM and TP at C3, and the PL at C4, along with reduced fCSA in the SCM at C4 (all p < 0.05). No significant associations were observed between CAS and disc degeneration.
CAS was associated with cervical muscle atrophy pointing toward a role of vascular health in muscle degeneration. In contrast, disc degeneration showed no association with CAS, suggesting that muscle atrophy and disc degeneration may follow distinct degenerative or metabolic pathways.
Figures and tables
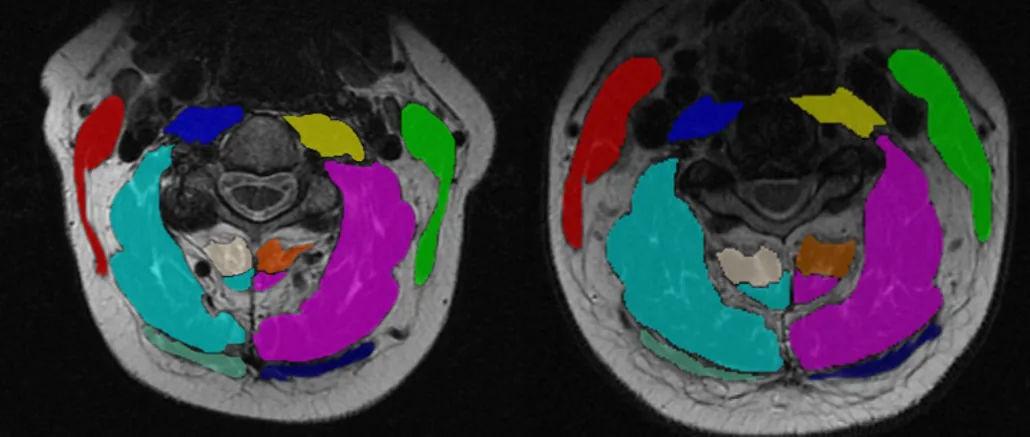
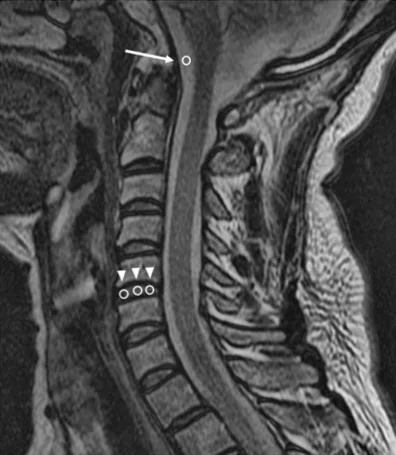
As submitted with the abstract. Tap a figure to open it at full size.