
Basic Science & Economics
Synthetic CT from Diagnostic Spine MRI: a Multi-Center Approach for Radiation-Free Bone Visualization
- UMC Utrecht, Utrecht, Netherlands
- MRIguidance B.V., Utrecht, Netherlands
- Amphia ziekenhuis, Breda, Netherlands
- Amsterdam Universitair Medisch Centrum, Amsterdam, Netherlands
- Amsterdam UMC, Amsterdam, Netherlands
- Elisabeth-TweeSteden Ziekenhuis, Tilburg, Netherlands
- Erasmus Medisch Centrum, Rotterdam, Netherlands
- HOCH Health Ostschweiz, Kantonsspital St.Gallen, St. Gallen, Switzerland
- Sengkang General Hospital, Singapore, Singapore
- UZ Gent, Gent, Belgium
- UZ Leuven, Leuven, Belgium
Abstract
Synthetic CT (sCT) generation from MRI promises radiation-free 3D bone visualization. Current methods are limited by single-center validation, a need for dedicated scans, or low-resolution outputs. This study aimed to develop and validate a clinically viable sCT method that overcomes these limitations by generating synthetic CT (sCT) from routine diagnostic spine MRI.
Using paired MRI/CT scans from 199 patients across nine centers spanning a wide range of spinal pathologies, anatomical regions and MRI sequences, we trained a Multi-Center Network on data from eight centers. Its performance on the unseen ninth center was compared to two benchmarks: a Single-Center Network (trained only on that center's data) and an All-Centers Network (trained on all centers’ data). This comparison was performed for the three largest centers. The sCTs’ and CTs’ intensities were compared using mean absolute error (MAE) and correlation coefficient (r) inside the vertebrae. Vertebrae were automatically segmented in the CT and sCT and evaluated using mean surface distance (mSD).
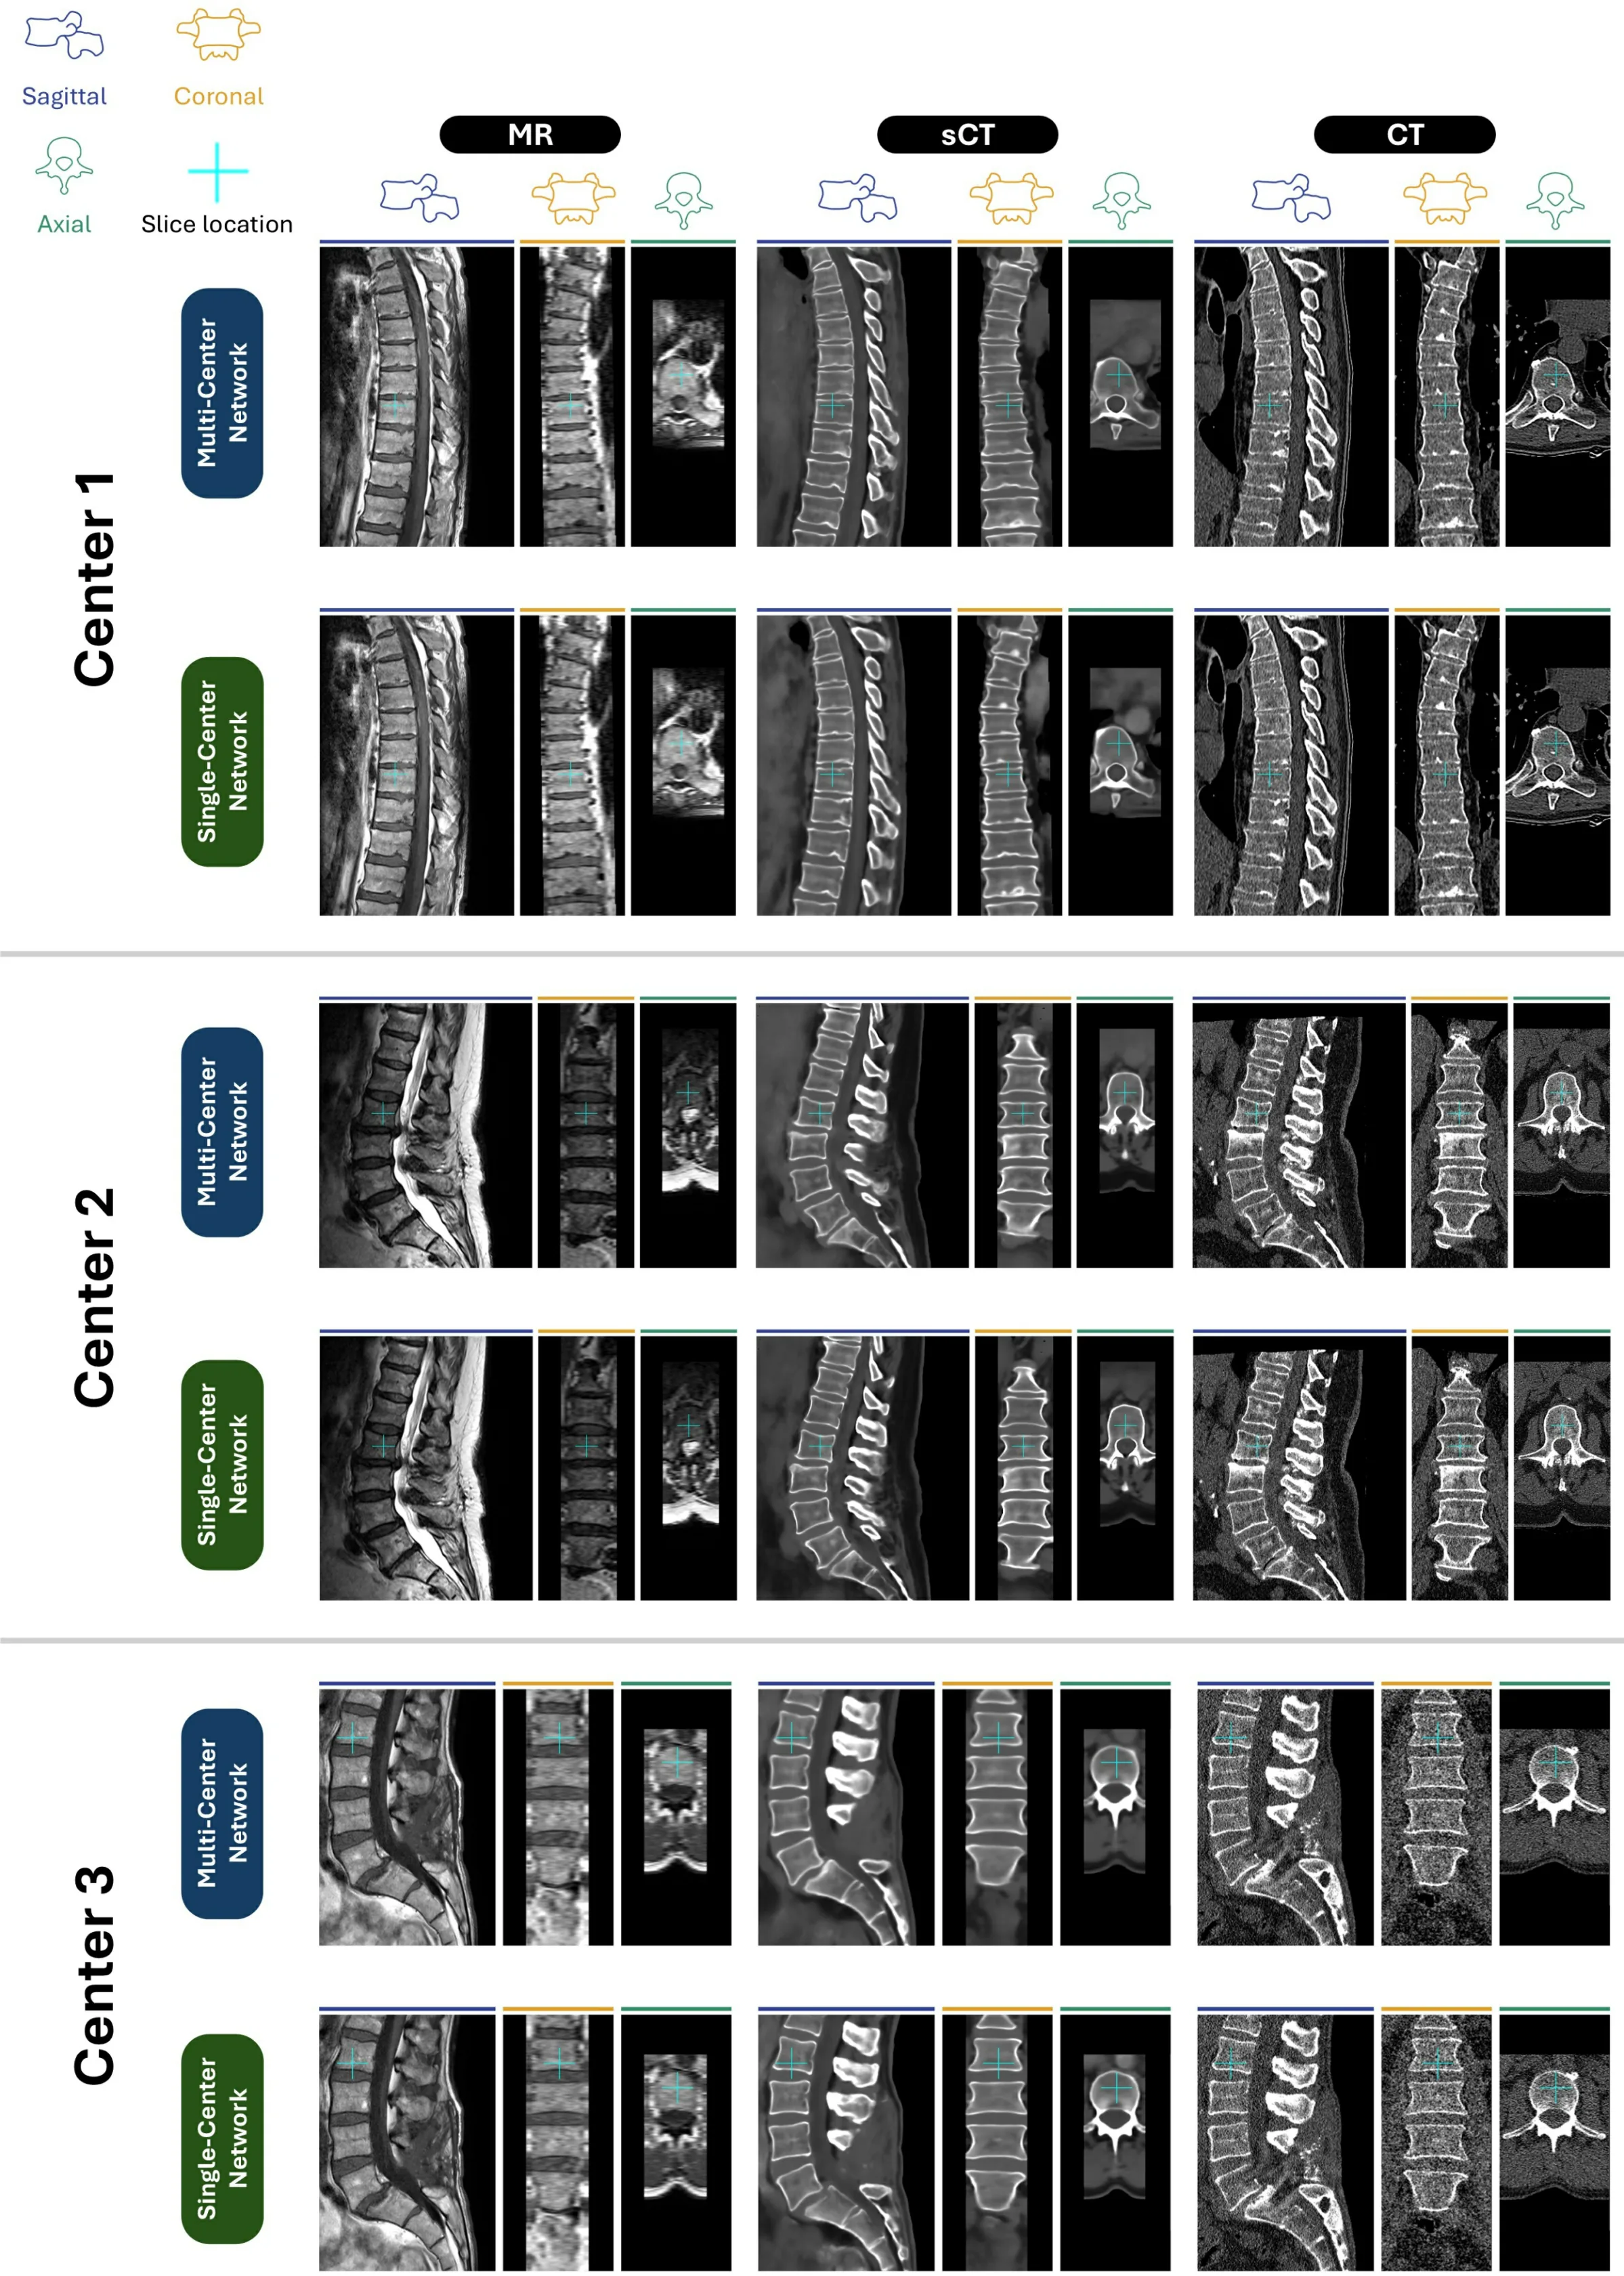
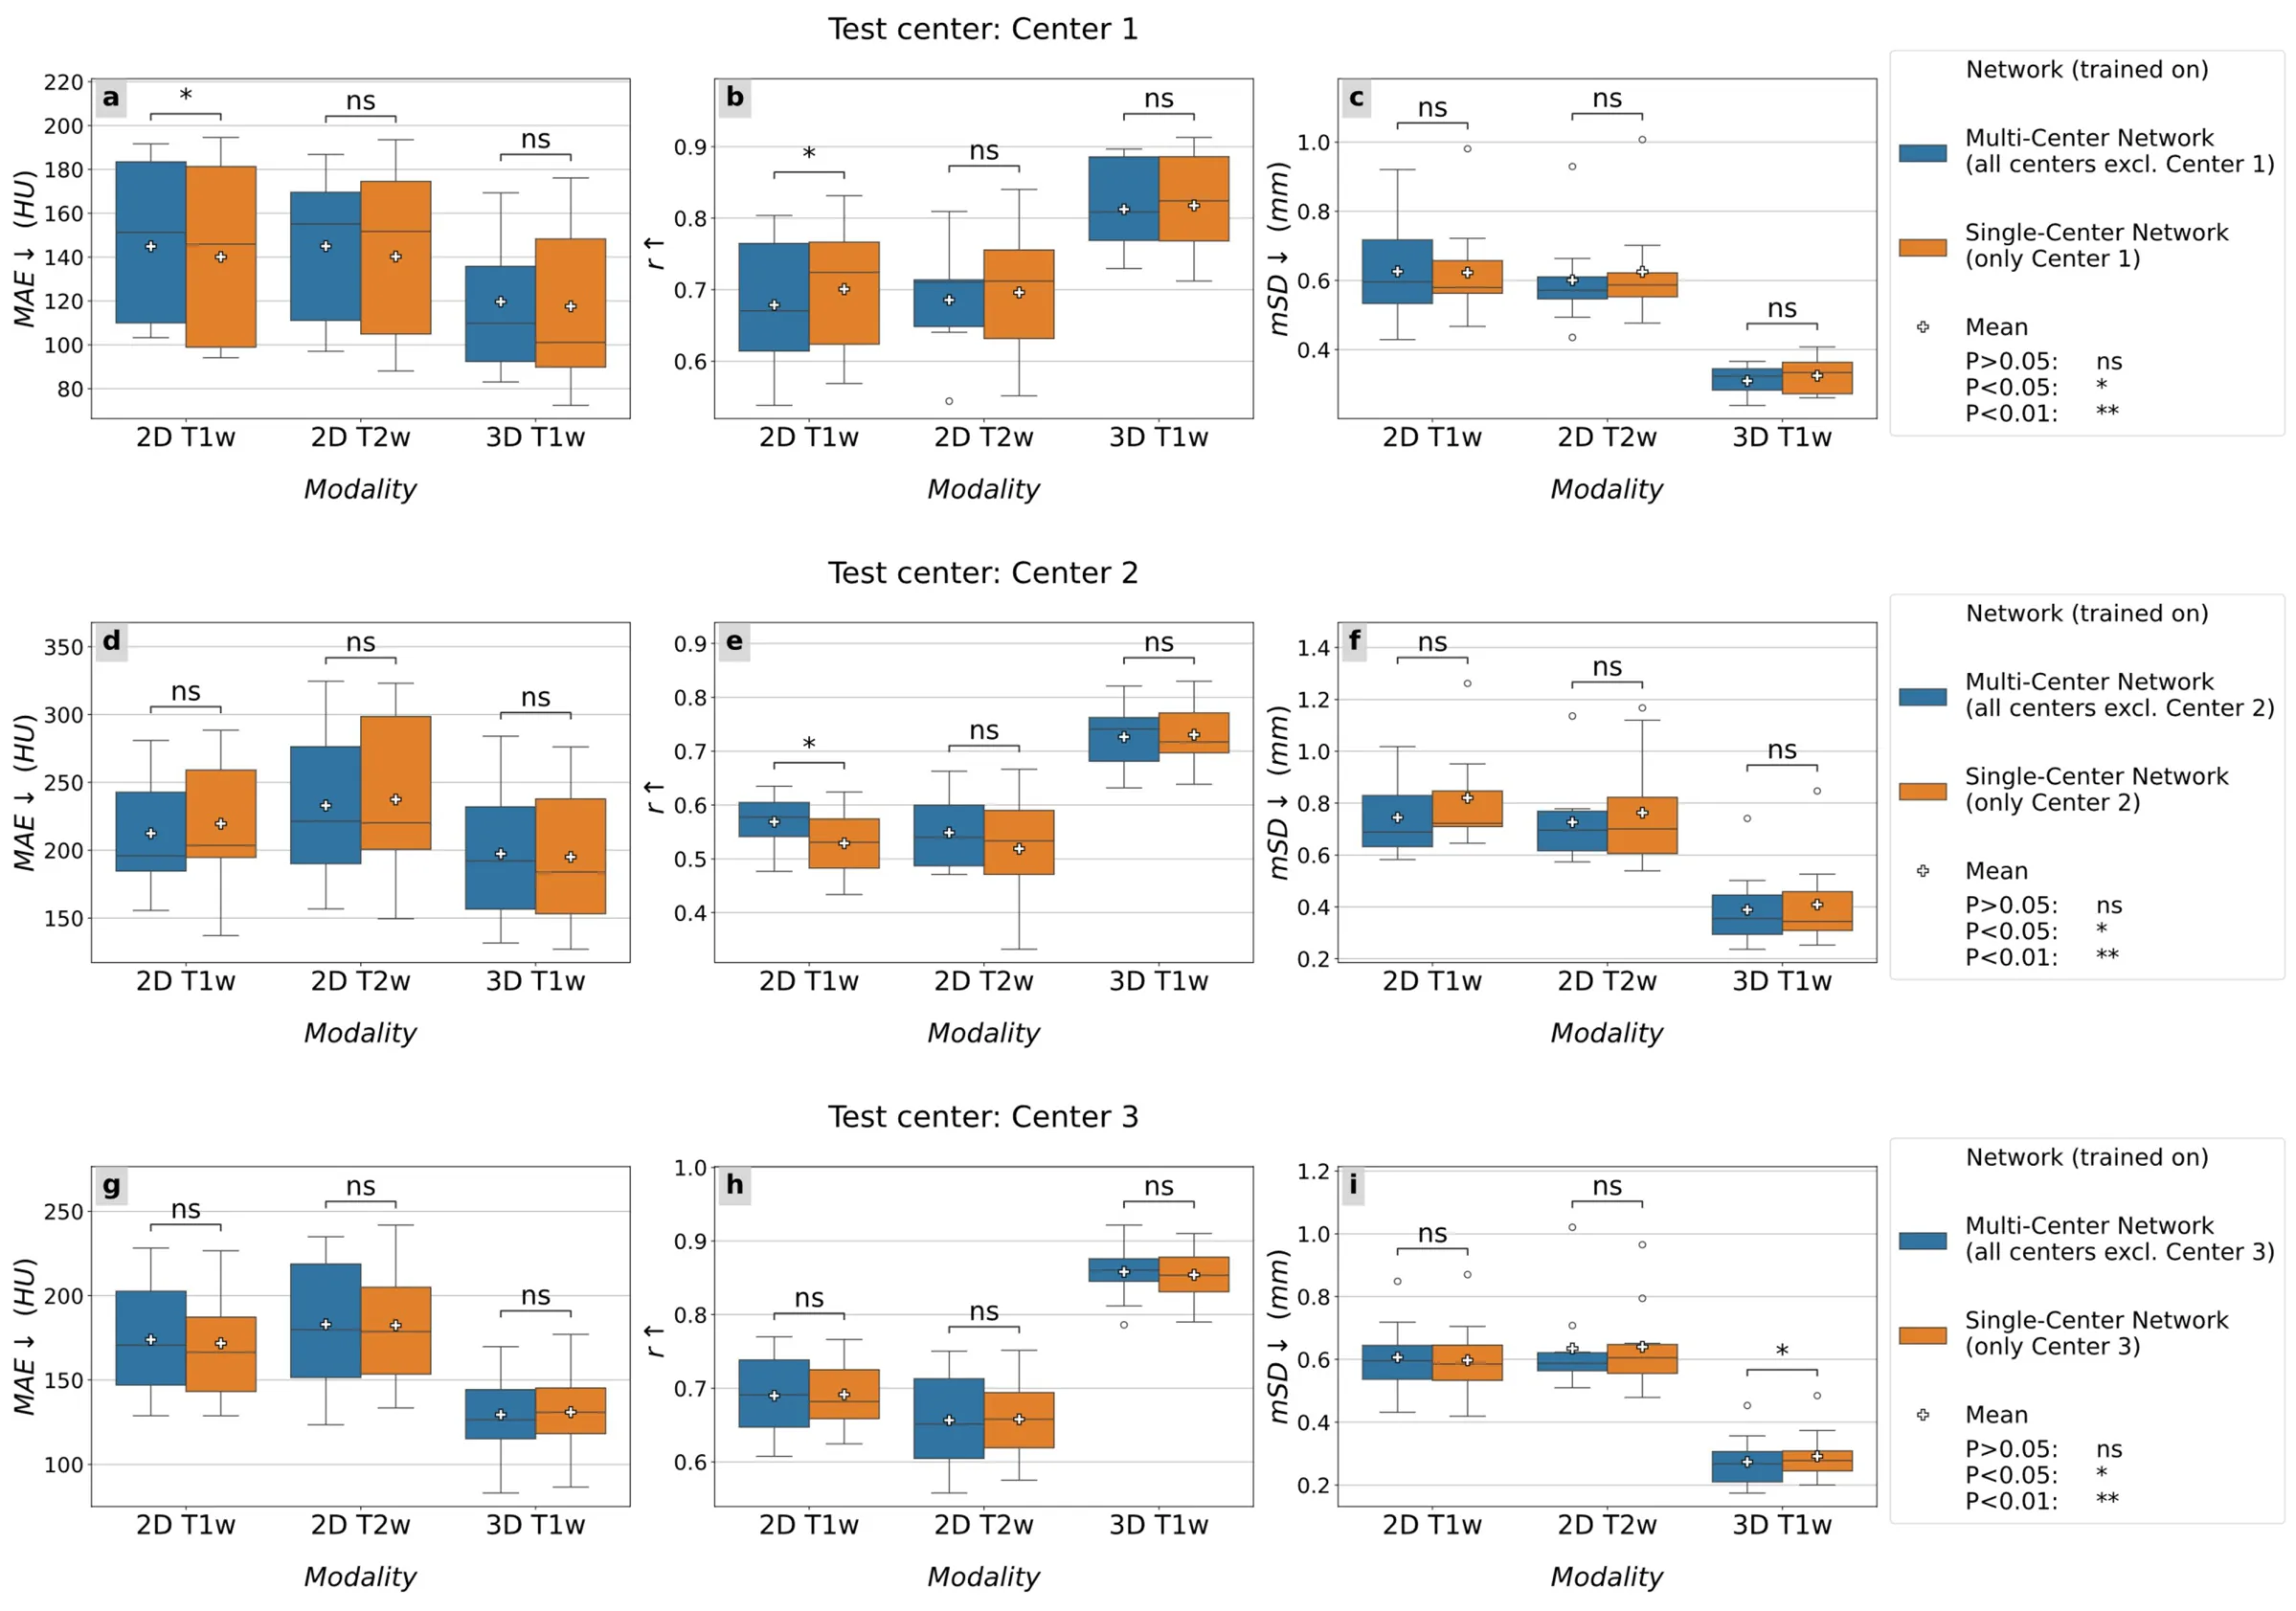
The Multi-Center Network (trained without the test center's data) performed equally to the Single-Center Network (trained with the test center’s data) in terms of MAE, r ,and mSD as shown qualitatively in Fig. 1 and quantitatively in Fig. 2. The Multi-Center Networks also achieved similar performance to the All-Centers Network with non-significant differences in 74% of comparisons and an average of 1.5% difference in metric values. This performance was consistent across different MRI scan types (T1-weighted, T2-weighted, 2D sequence, 3D sequence) and all three test centers.
A single AI model, trained on a large, diverse multicenter dataset, can successfully generate high-quality 3D sCTs from routine diagnostic MRI at new, unseen centers, performing similarly to networks trained on data from this center. Additionally, our method was capable of converting any MR (2D T1w, 2D T2w, or 3D T1w) into synthetic CT using a single network. Notably, the networks converted 2D multi-slice MR images with 3.3-4.4 mm slice spacing into (sub)millimeter resolution 3D sCTs and average vertebral surface distance of 0.65 mm. This demonstrates an important step towards radiation-free bone visualization from routine diagnostic MR scans across diverse imaging centers, supporting broader clinical and surgical applications.
Figures and tables
As submitted with the abstract. Tap a figure to open it at full size.