
Growing Spine
Investigation of Cross-Sectional Thickness of Paraspinal Muscles in Idiopathic Scoliosis Using 3D Ultrasound and Magnetic Resonance Imaging
- The Hong Kong Polytechnic University, Hong Kong, Hong Kong
- The Hong Kong Polytechnic University, Hong Kong, China
- Australian National University, Canberra ACT, Australia
- The Chinese University of Hong Kong, Hong Kong, China
Abstract
Idiopathic scoliosis (IS) is a 3D musculoskeletal disorder affecting mainly adolescent females. Despite the potential role of paraspinal muscle in the etiopathogenesis and progression of IS, current assessments are mostly focused on the spinal curvature. MRI, the most commonly used modality for assessing muscle morphology, is limited to the supine position. Given the significant difference in convex/concave paraspinal muscles between different postures, a 3D ultrasound system that allows imaging in any posture was developed. This study examines the accuracy of 3D ultrasound in measuring the cross-sectional thickness of paraspinal muscles in prone and standing positions.
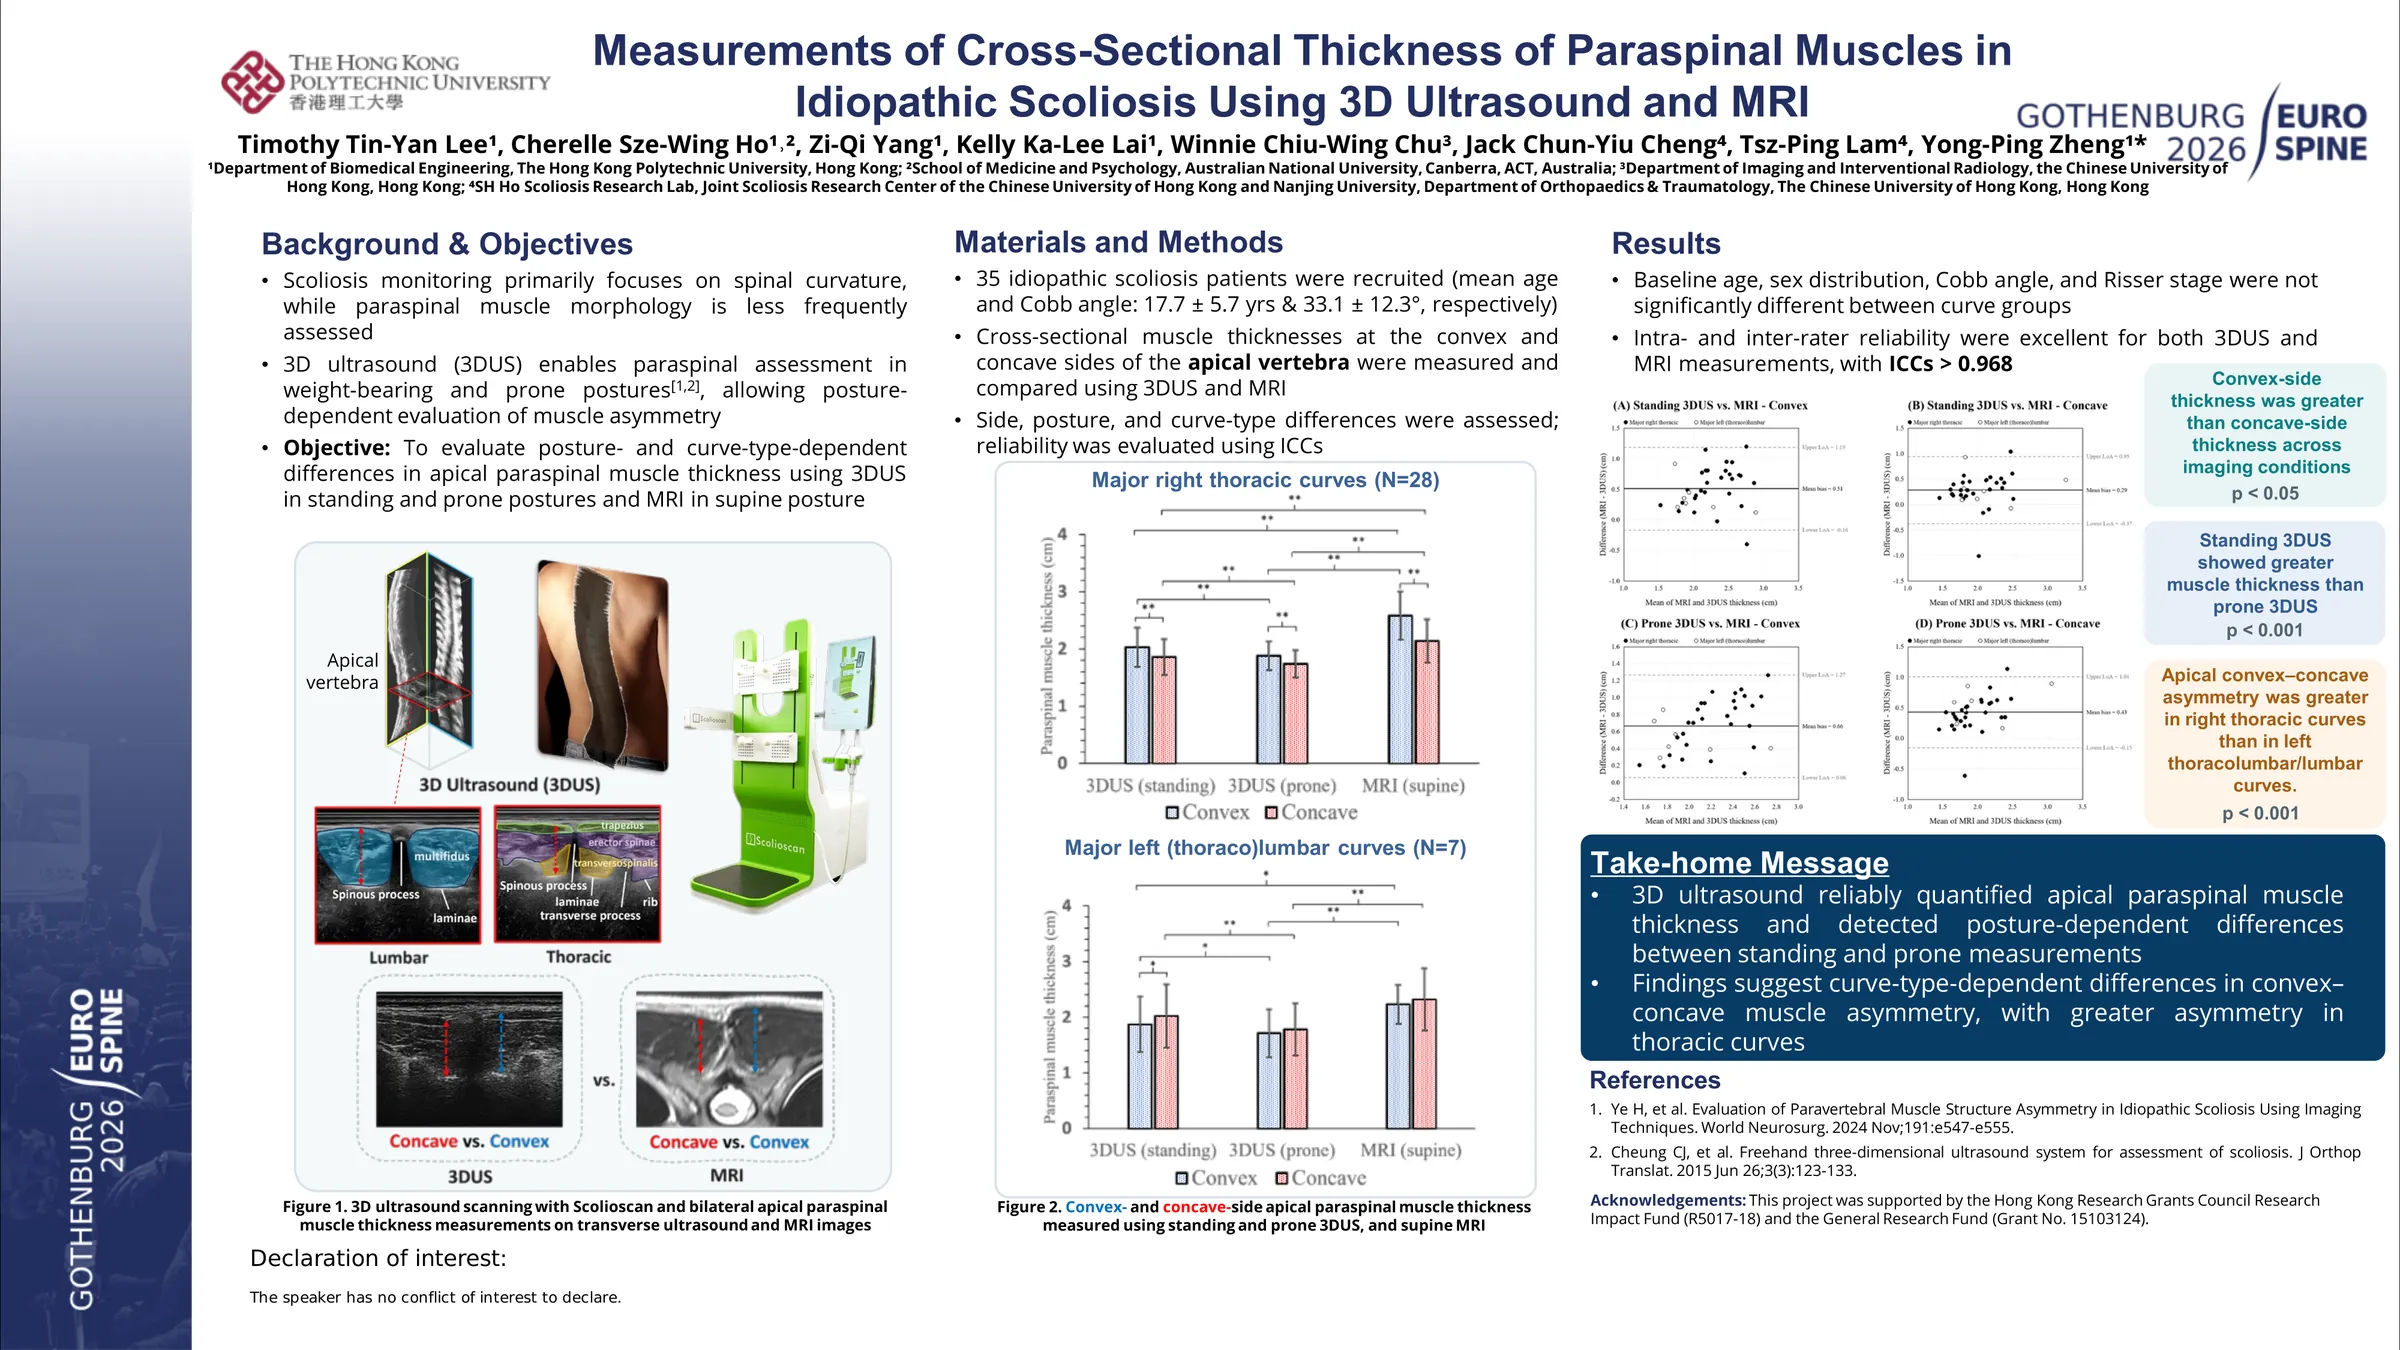
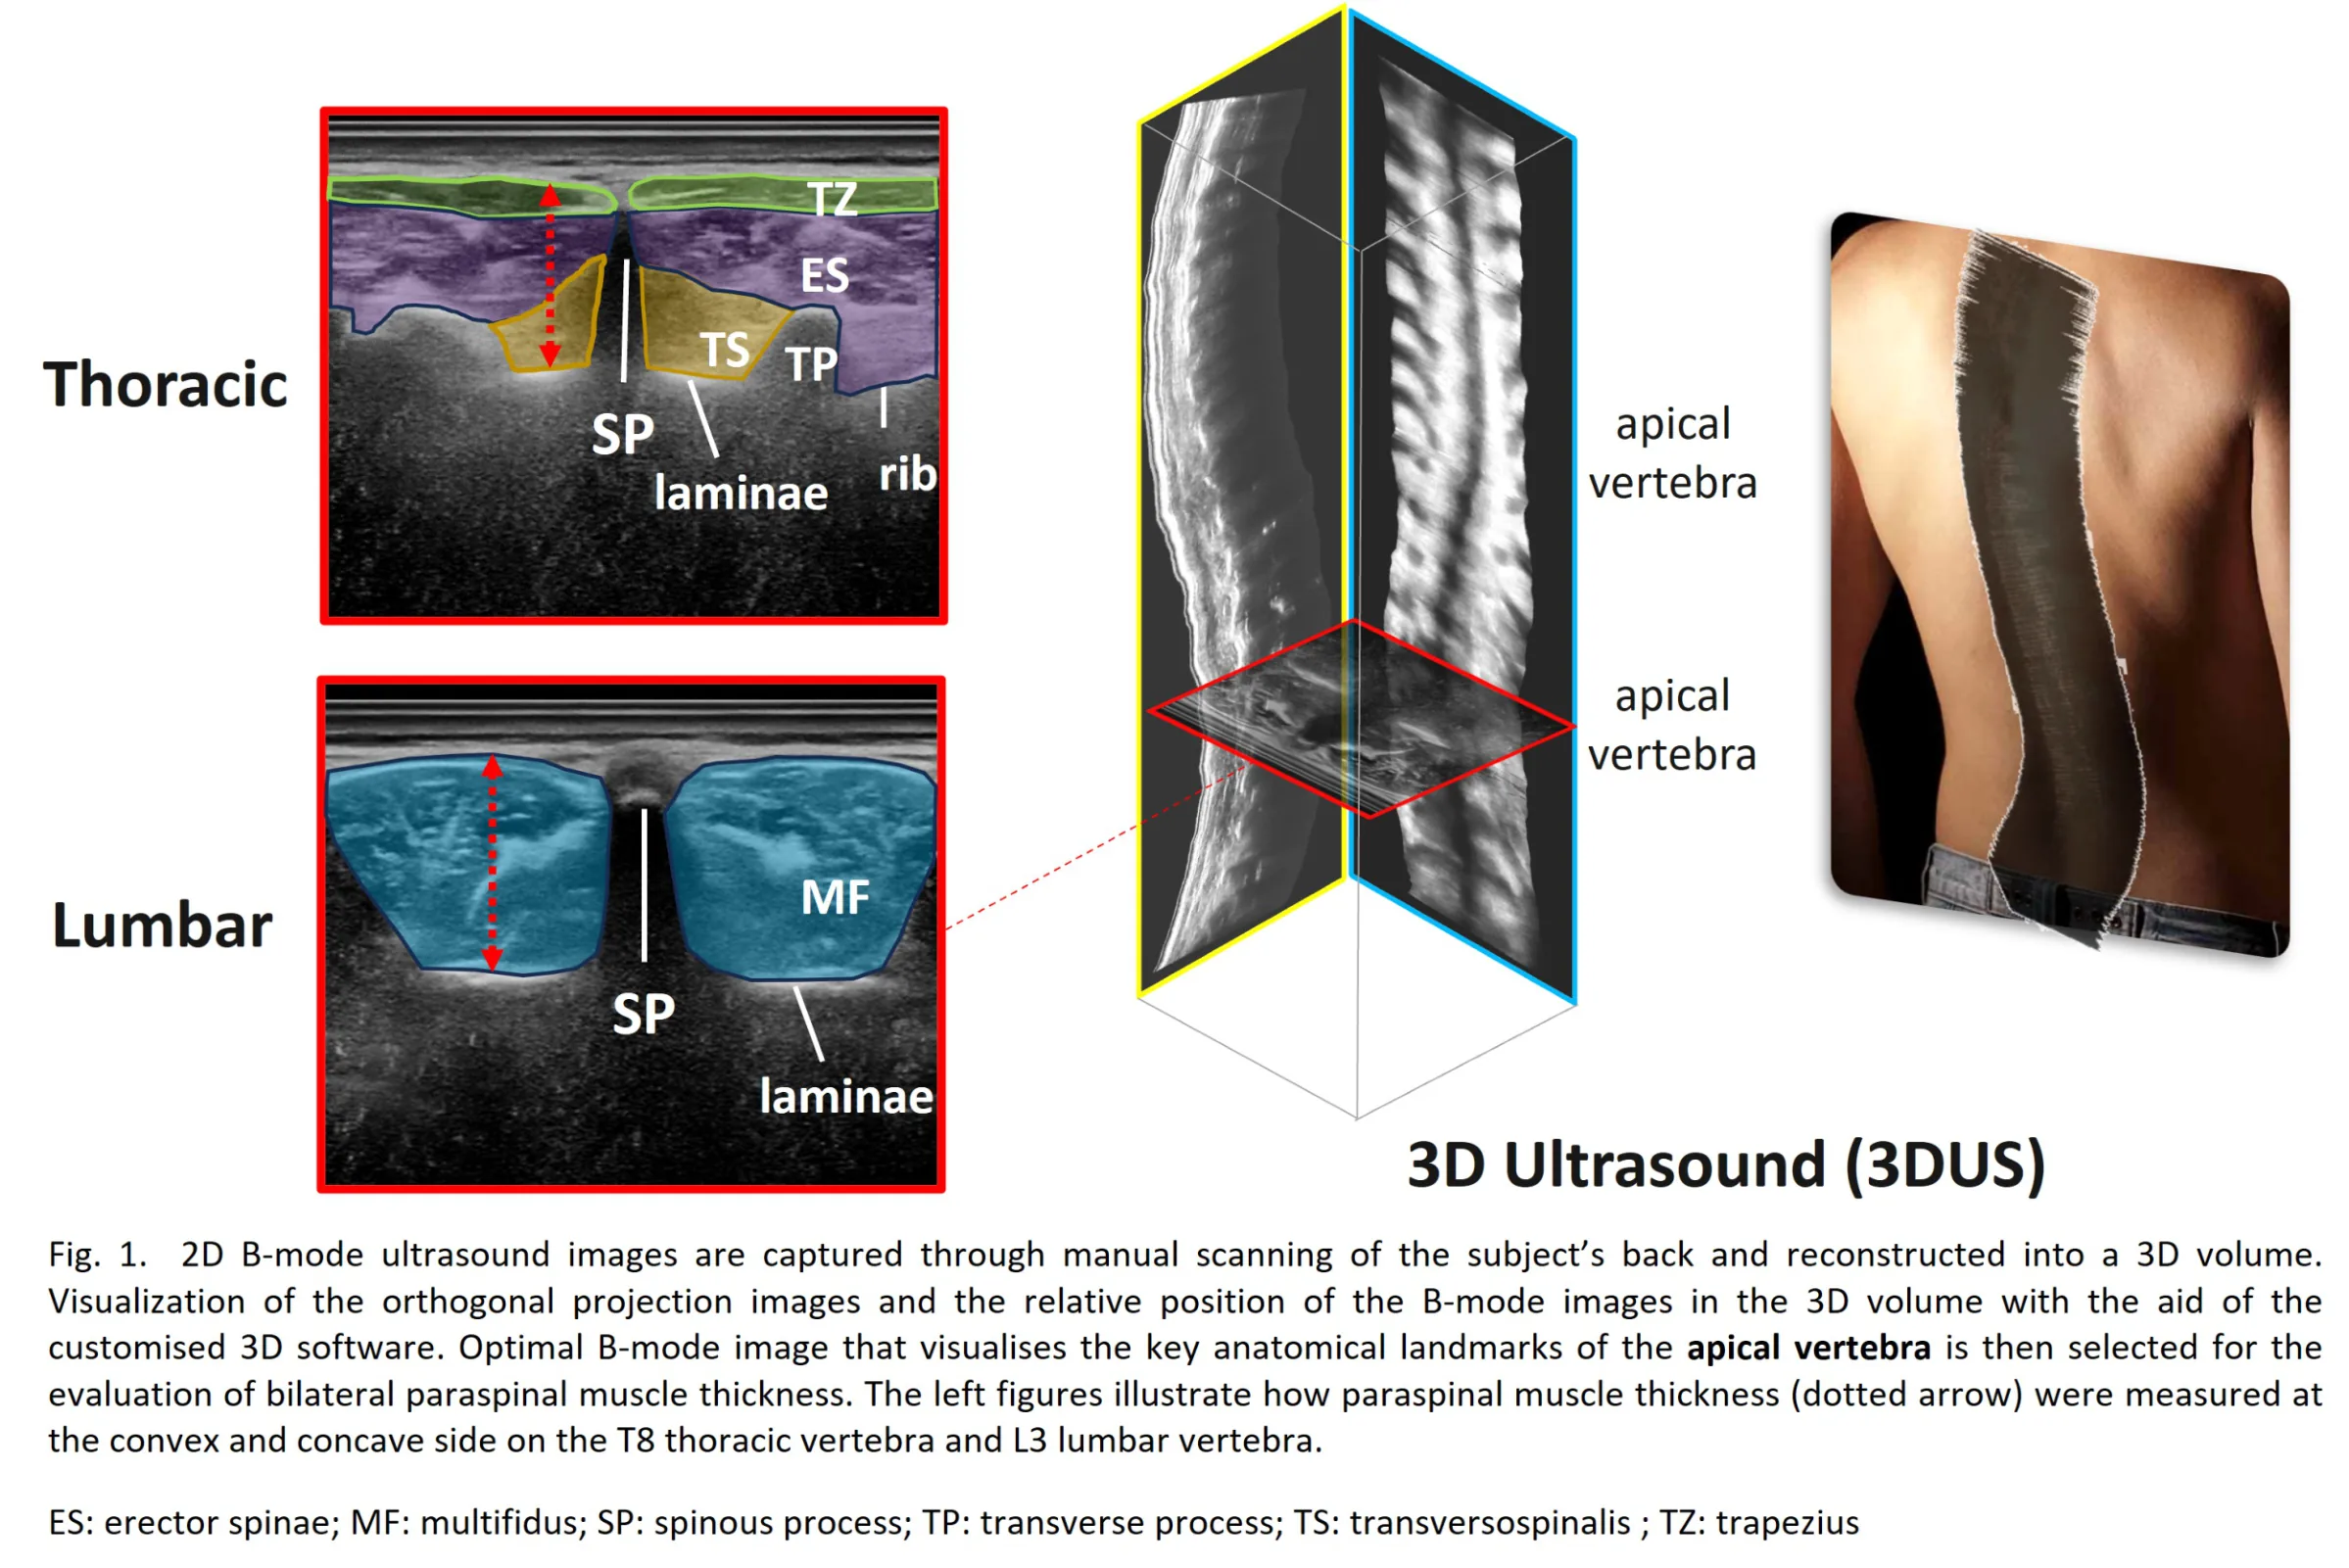
35 patients (23 females, 12 males) with either major right thoracic curves (age: 17.9 ± 5.6 years old) or major left (thoraco)lumbar curves (age: 17.0 ± 6.6 years old) were enrolled. Each patient underwent 3D ultrasound in standing and prone positions and a supine MRI scanning. Cross-sectional muscle thicknesses at the convex and concave sides of the apical vertebra were measured in the above three conditions (Fig. 1). Intra-class correlation coefficients (ICC) with 95% confidence intervals were calculated to determine the repeatability of each evaluator’s measurements and the agreement between evaluators. The Bland-Altman test between 3D ultrasound and MRI measurements was analyzed. Convex–concave differences in muscle thickness were examined using either the Wilcoxon signed‑rank test or paired t-test, depending on data normality.
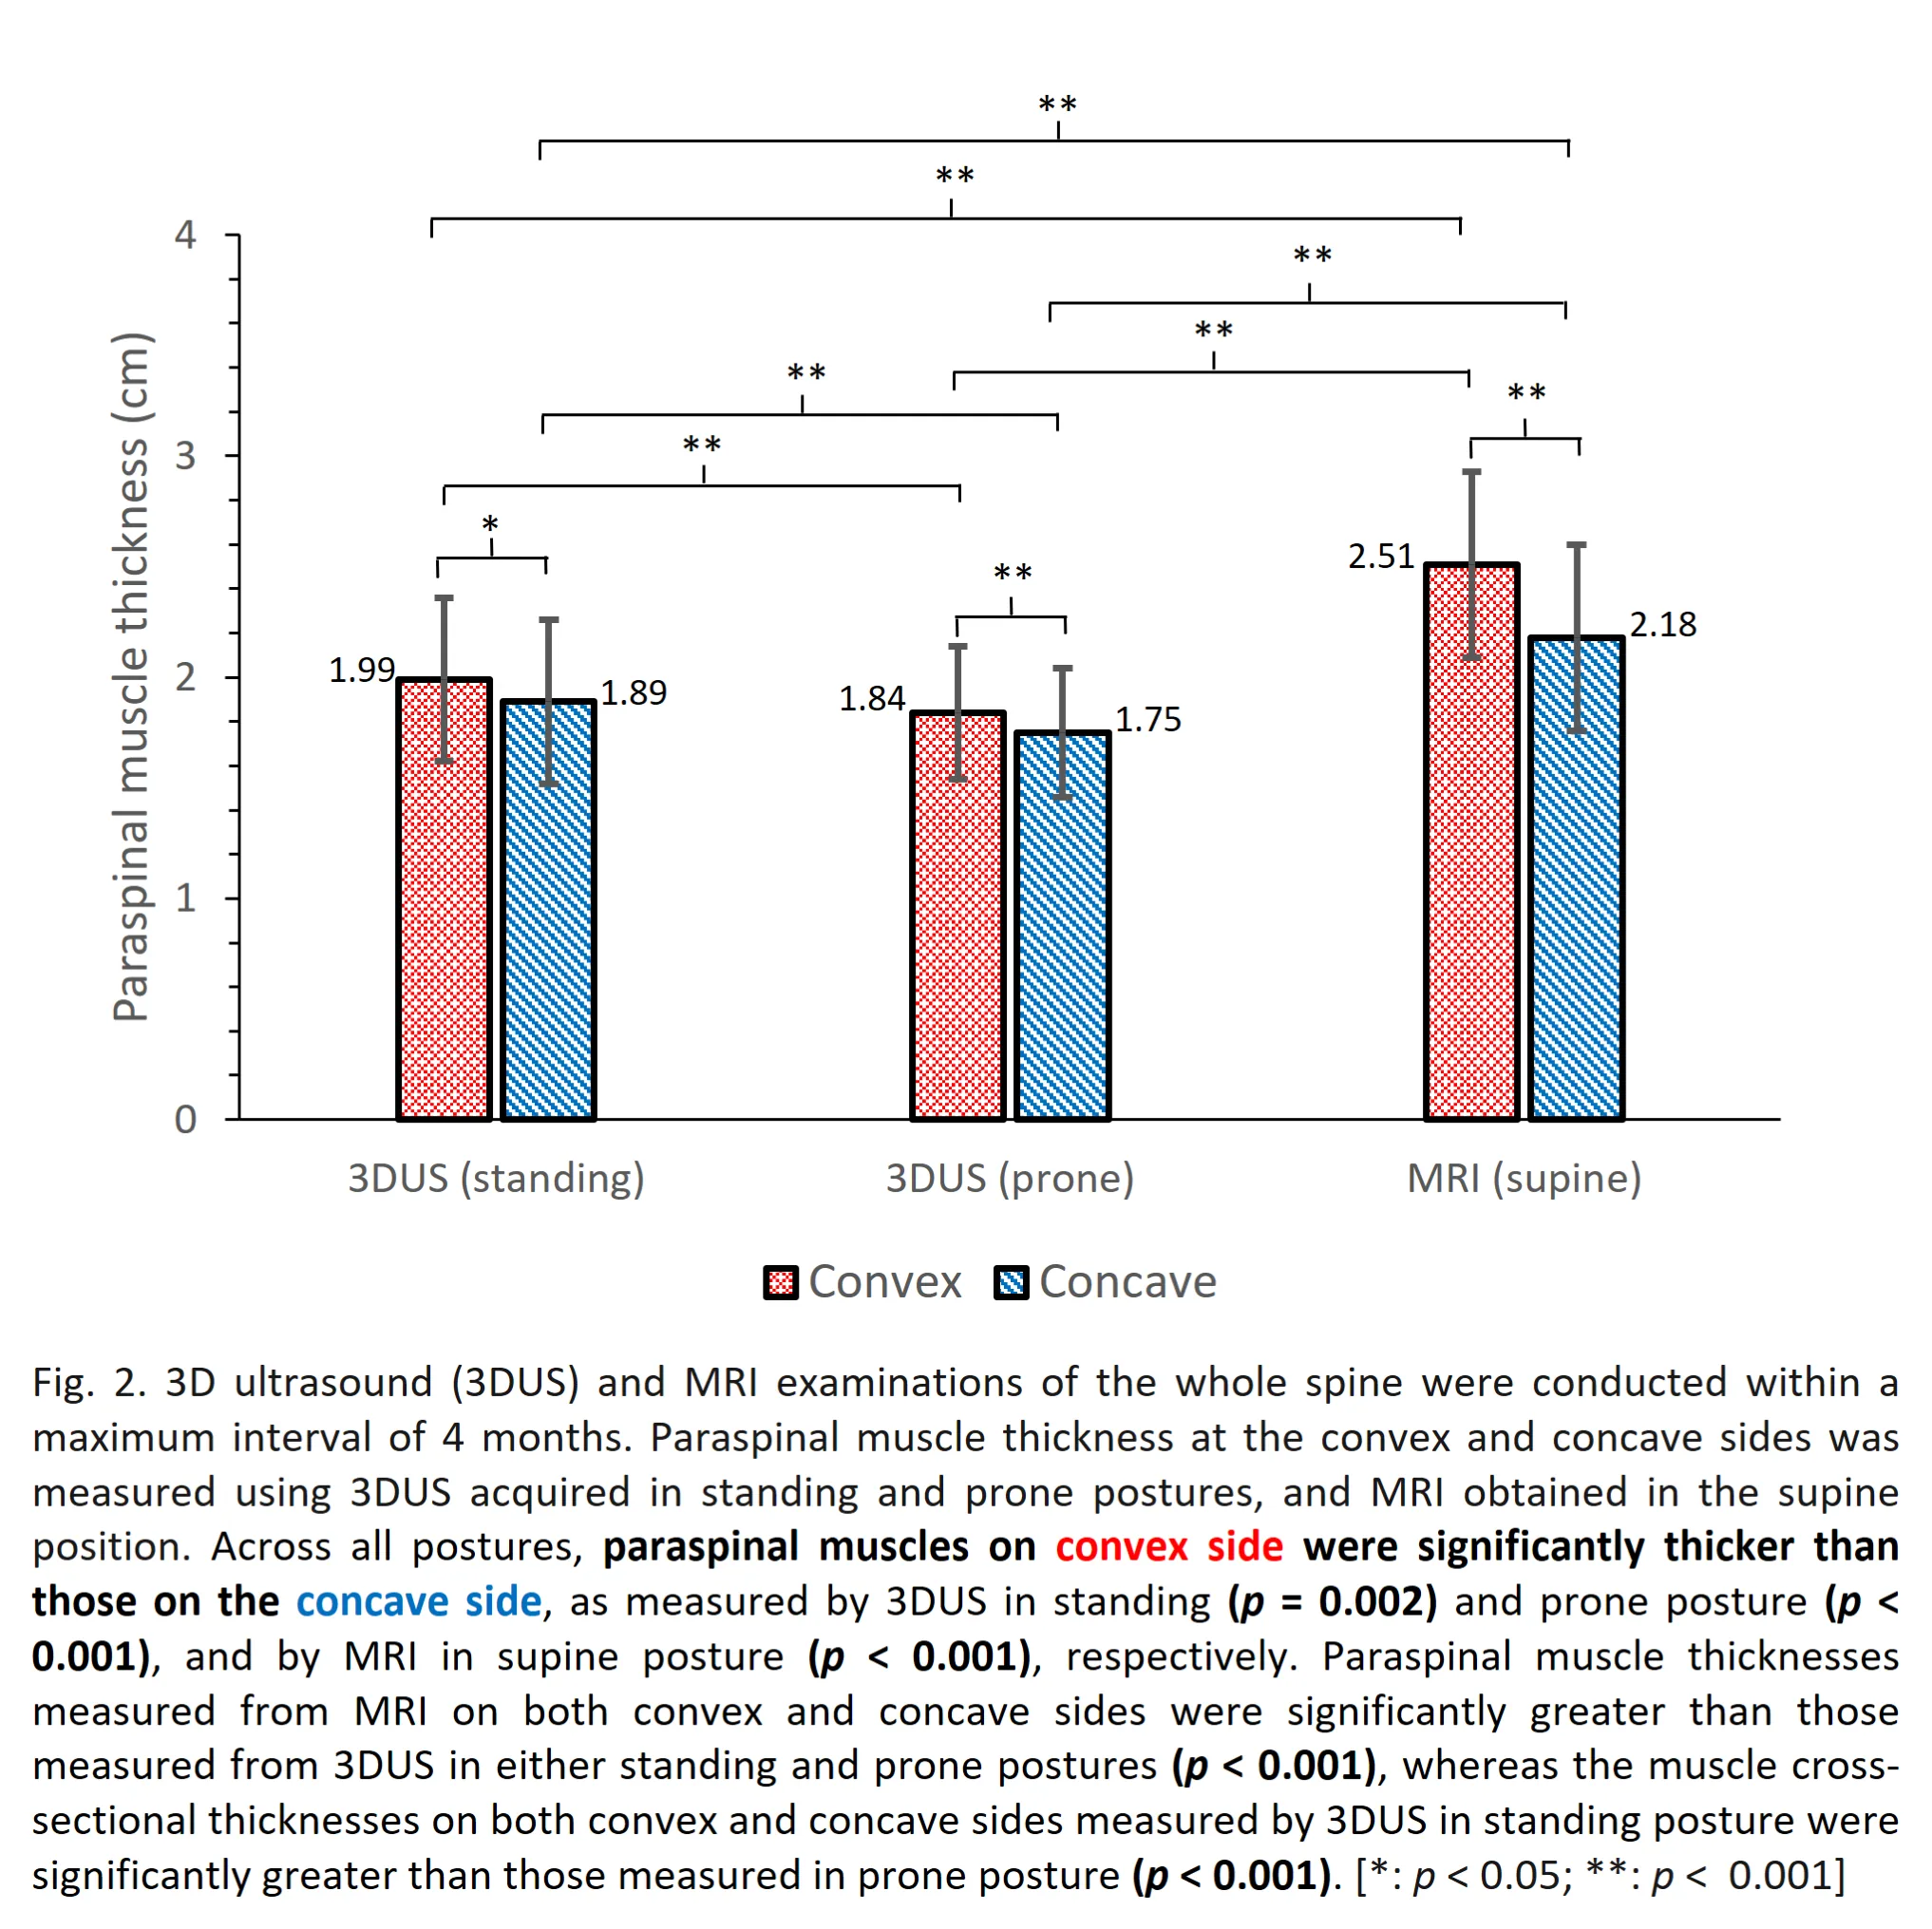
3D ultrasound and MRI demonstrated excellent intra- and inter-rater reliability for measuring paraspinal muscle cross-sectional thickness, with ICC values ranging from 0.968 to 0.996. The standard error of measurement (SEM) and minimal detectable change (MDC) were ≤ 0.02 cm and ≤ 0.05 cm for 3D ultrasound, respectively, and ≤ 0.07 cm for MRI. The bias between 3D ultrasound and MRI measurements was +0.51cm and +0.66cm for the convex side, and +0.29cm and +0.73cm for the concave side in standing and prone positions, respectively. Paraspinal muscles on the convex side were statistically significantly thicker than the concave side in both modalities. Cross-sectional thickness differences were greater in standing than prone postures (p < 0.001), and more pronounced in patients with thoracic curves (p < 0.001) (Fig. 2).
The study demonstrated 3D ultrasound as a reliable method for assessing paraspinal muscle asymmetry in patients with IS. Significant cross-sectional thickness differences between convex and concave sides and different asymmetric muscle thickness patterns suggests the need for controlling curve types and postures of patients during evaluation. Future research should explore the coupling effect between spinal deformity and muscle asymmetry, considering different curve types and improving scanning techniques.
Figures and tables
As submitted with the abstract. Tap a figure to open it at full size.