
Adult Deformity
Concordance Analysis Between GAP Score and T4-L1 Hip Axis Classifications: Implications for Mechanical Failure Risk Stratification
- Vall d'Hebron University Hospital, Barcelona, Spain
- La Paz University Hospital, Madrid, Spain
- Ramón y Cajal Hospital, Madrid, Spain
- Chu De Bordeaux - Haut-Lévêque, Bordeaux, France
- ELSAN Polyclinique Jean Villar, Clinique du Dos, Bordeaux-Terrefort, Pessac, France
- Clinique Terrefort - Bruges, Bordeaux, France
- CHRU strasbourg - Les Hôpitaux Universitaires de Strasbourg , Strasbourg, France
- Acibadem University Maslak Hospital, Istanbul, Türkiye
- Schulthess Klinik, Zurich, Switzerland
- . European Spine Study Group (Vall d'Hebron University Hospital, Barcelona, Spain
Abstract
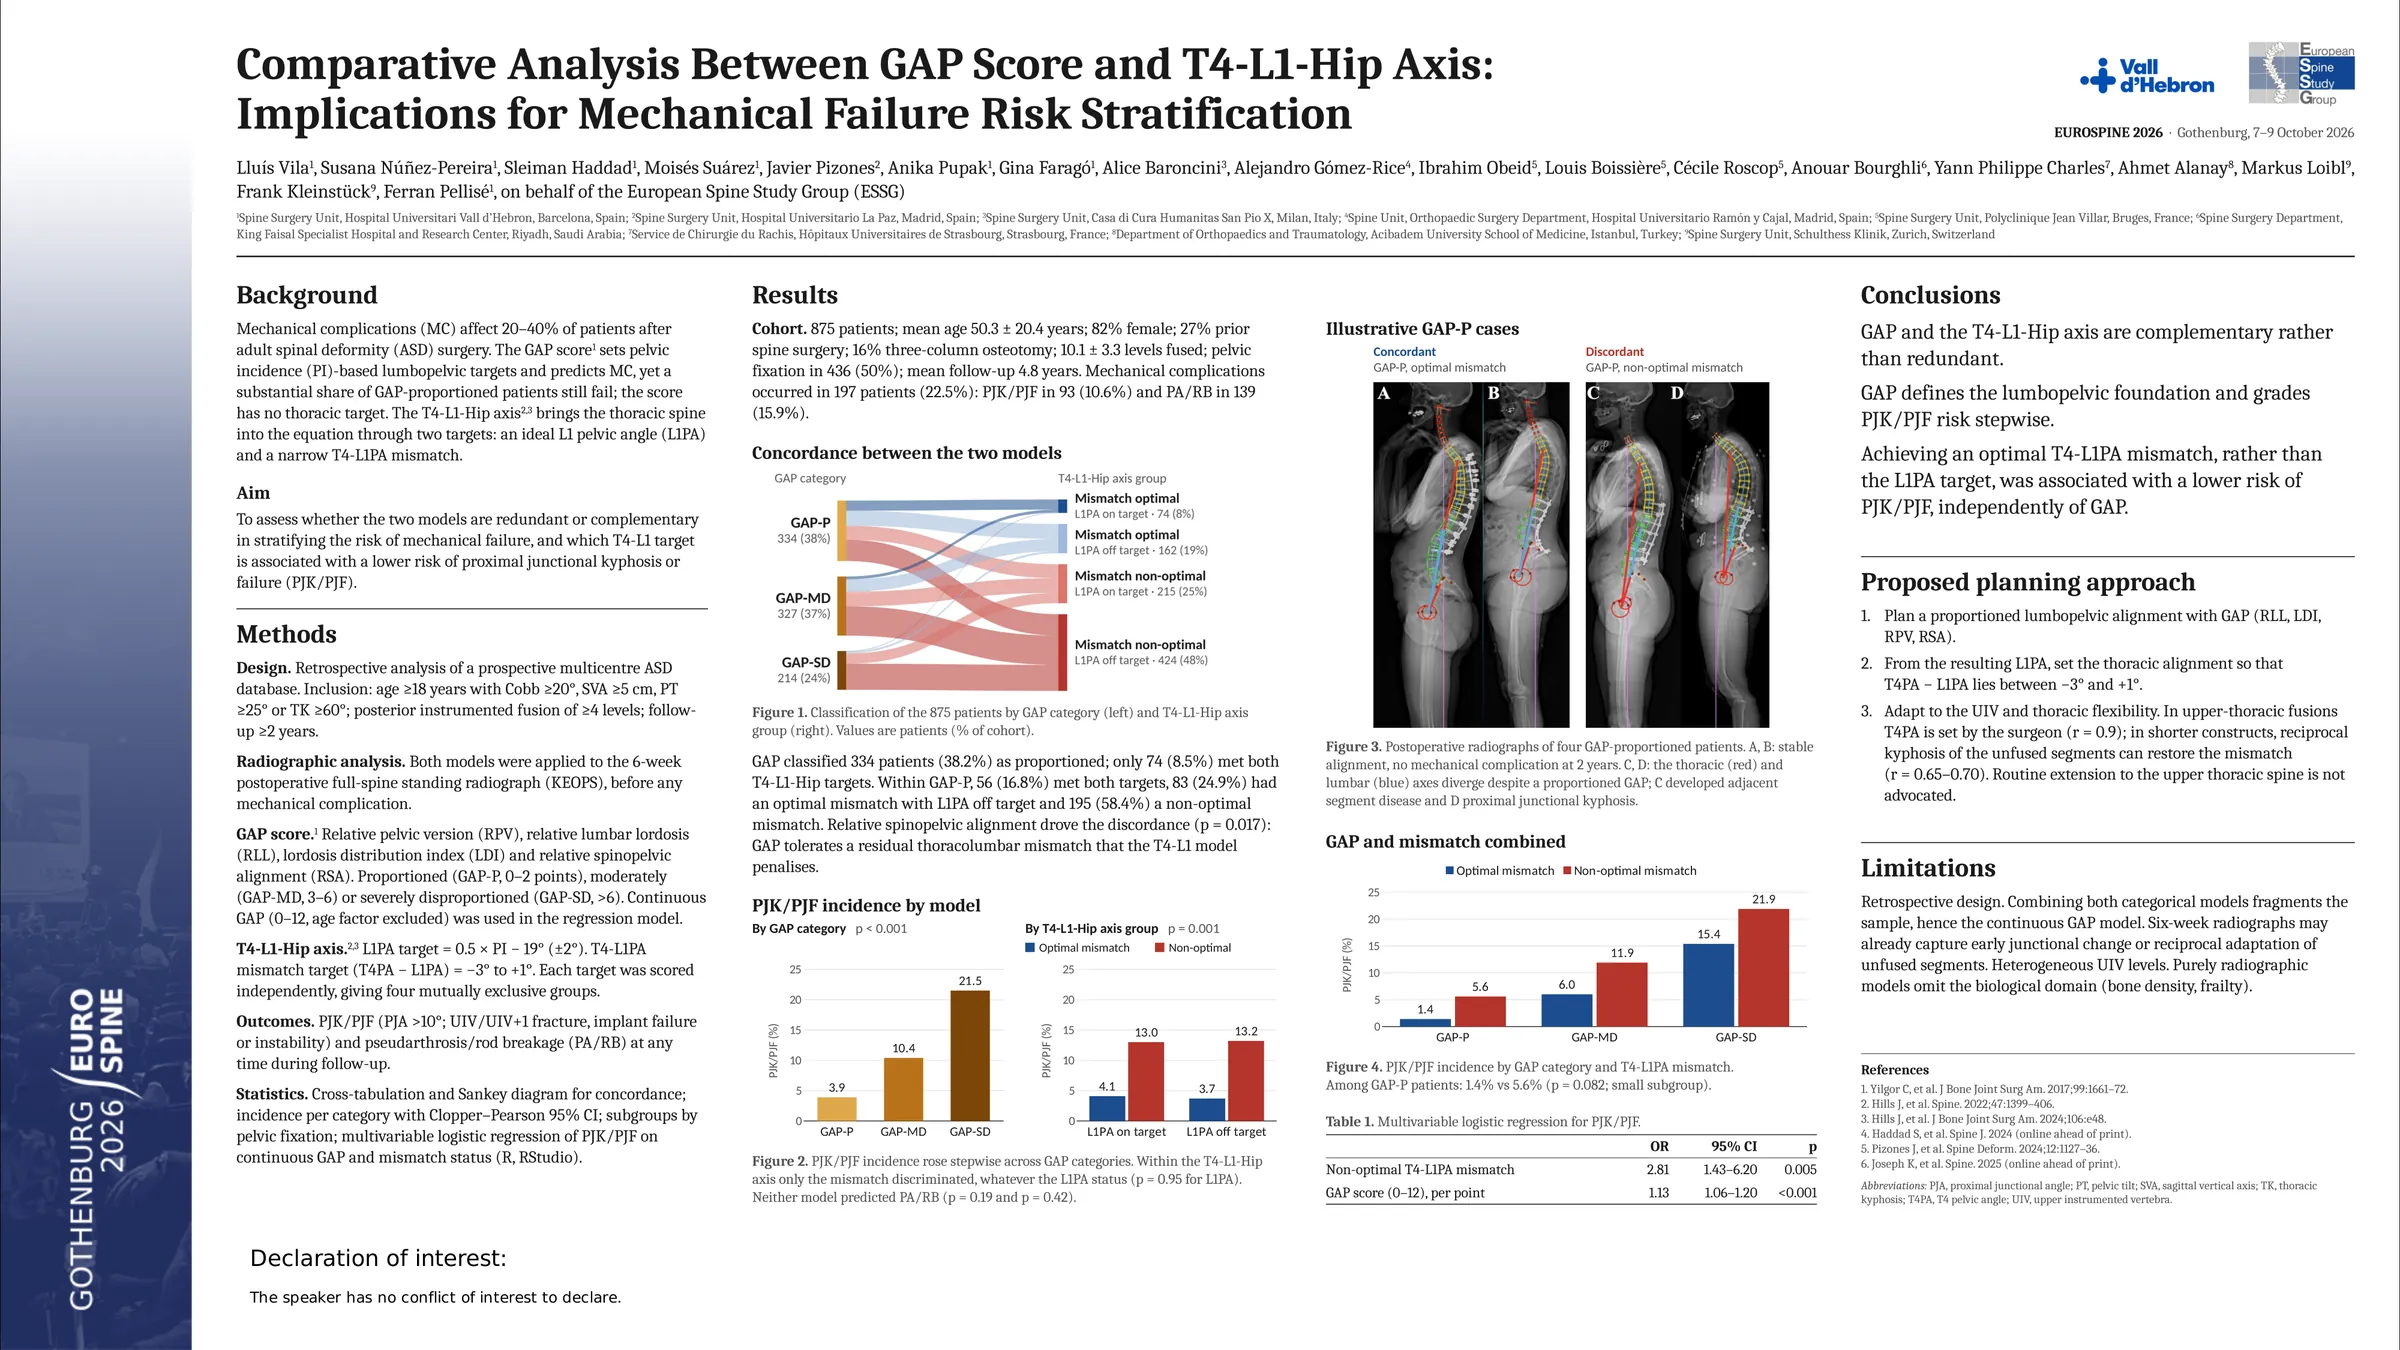
Surgical planning for adult spinal deformity (ASD) has evolved toward individualized targets. While the Global Alignment and Proportion Score (GAP) marked a major advancement, up to 40% of patients considered well aligned (GAP-Proportioned) still experience mechanical complications (MC). This persistent failure rate suggests that pelvic-driven models may overlook latent geometric conflicts, particularly in the thoracic spine. Recently, the T4-L1-Hip Axis has emerged as a novel model that explicitly integrates thoraco-lumbar harmony. This study compares the GAP Score and the T4-L1 Axis to determine if they are redundant or complementary tools. Specifically, we aim to analyze their concordance, identify the geometric drivers of discordance, and evaluate whether integrating the T4-L1-Hip Axis into the GAP Score improves the prediction of MC. We hypothesize that these models provide complementary rather than redundant information in realignment targets and their combination can lead to better prediction of MC.
This is a retrospective analysis of a prospectively collected, multicenter adult spinal deformity (ASD) database. We included 875 patients (age >=18; >=4 levels fused; 2-year follow-up). Postoperative alignment was stratified by GAP score (Proportioned [P], Moderately [MD], and Severely Disproportioned [SD]) and T4-L1-Hip Axis (based on L1-Pelvic Angle (L1PA) and T4-L1PA mismatch targets). Primary endpoints were MC, stratified into proximal junctional kyphosis/failure (PJK/PJF) and pseudarthrosis/rod breakage (PA/RB).
The GAP score classified 38.2% (n=334) of patients as well aligned (GAP-P), whereas only 8.5% (n=74) met all T4-L1-Hip Axis targets. Among GAP-P patients, 83.2% failed at least one T4-L1 target; this discordance was primarily driven by the Relative Spinopelvic Alignment (RSA) parameter (p=0.017). PJK/PJF rates increased progressively with GAP categories (GAP-P: 3.9%, GAP-MD: 10.4%, GAP-SD: 21.5%; p<0.001). Conversely, PJK/PJF risk in the T4-L1-Hip Axis model was determined exclusively by the T4-L1PA mismatch regardless of L1PA compliance: 3.7–4.1% in T4-L1PA mismatch-Optimal groups vs 13.0% in T4-L1PA mismatch Non-optimal groups (p=0.001). Failing to restore optimal T4-L1PA mismatch was associated with a 4-fold higher risk of PJK/PJF (5.6% vs. 1.4%, OR 4.1, p=0.08) within the well-aligned GAP-P cohort. Neither model significantly stratified PA/RB risk.
The T4-L1-Hip Axis is a highly restrictive model that demonstrates high negative predictive value, attributed exclusively to the T4-L1PA mismatch. Conversely, the GAP Score is less restrictive and stratifies PJK/PJF risk gradually. Restoring the T4-L1PA mismatch in GAP-P patients reduces PJK/PJF risk by 4-fold.
Figures and tables
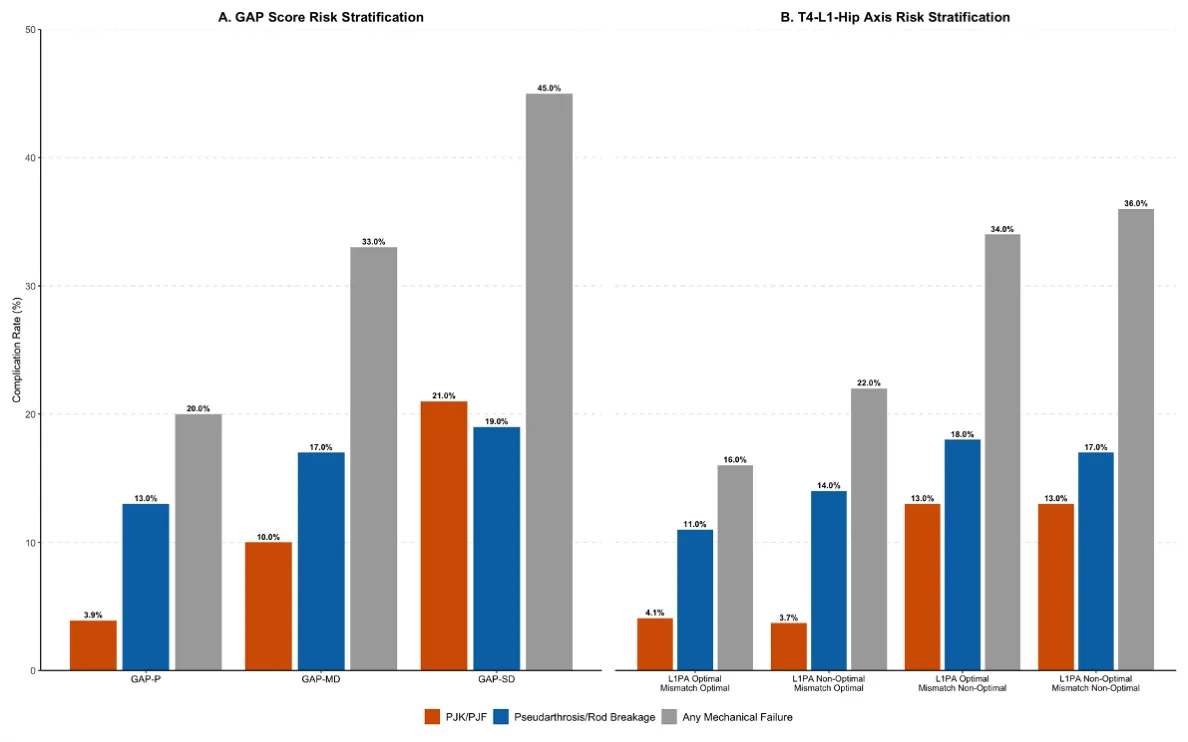
As submitted with the abstract. Tap a figure to open it at full size.