
Degenerative Thoracolumbar
Application of Vision Transformer for Automated Assessment of Lumbar Facet Joint Osteoarthritis Severity on CT Images
- Nantong First People's Hospital, Nantong, China
Abstract
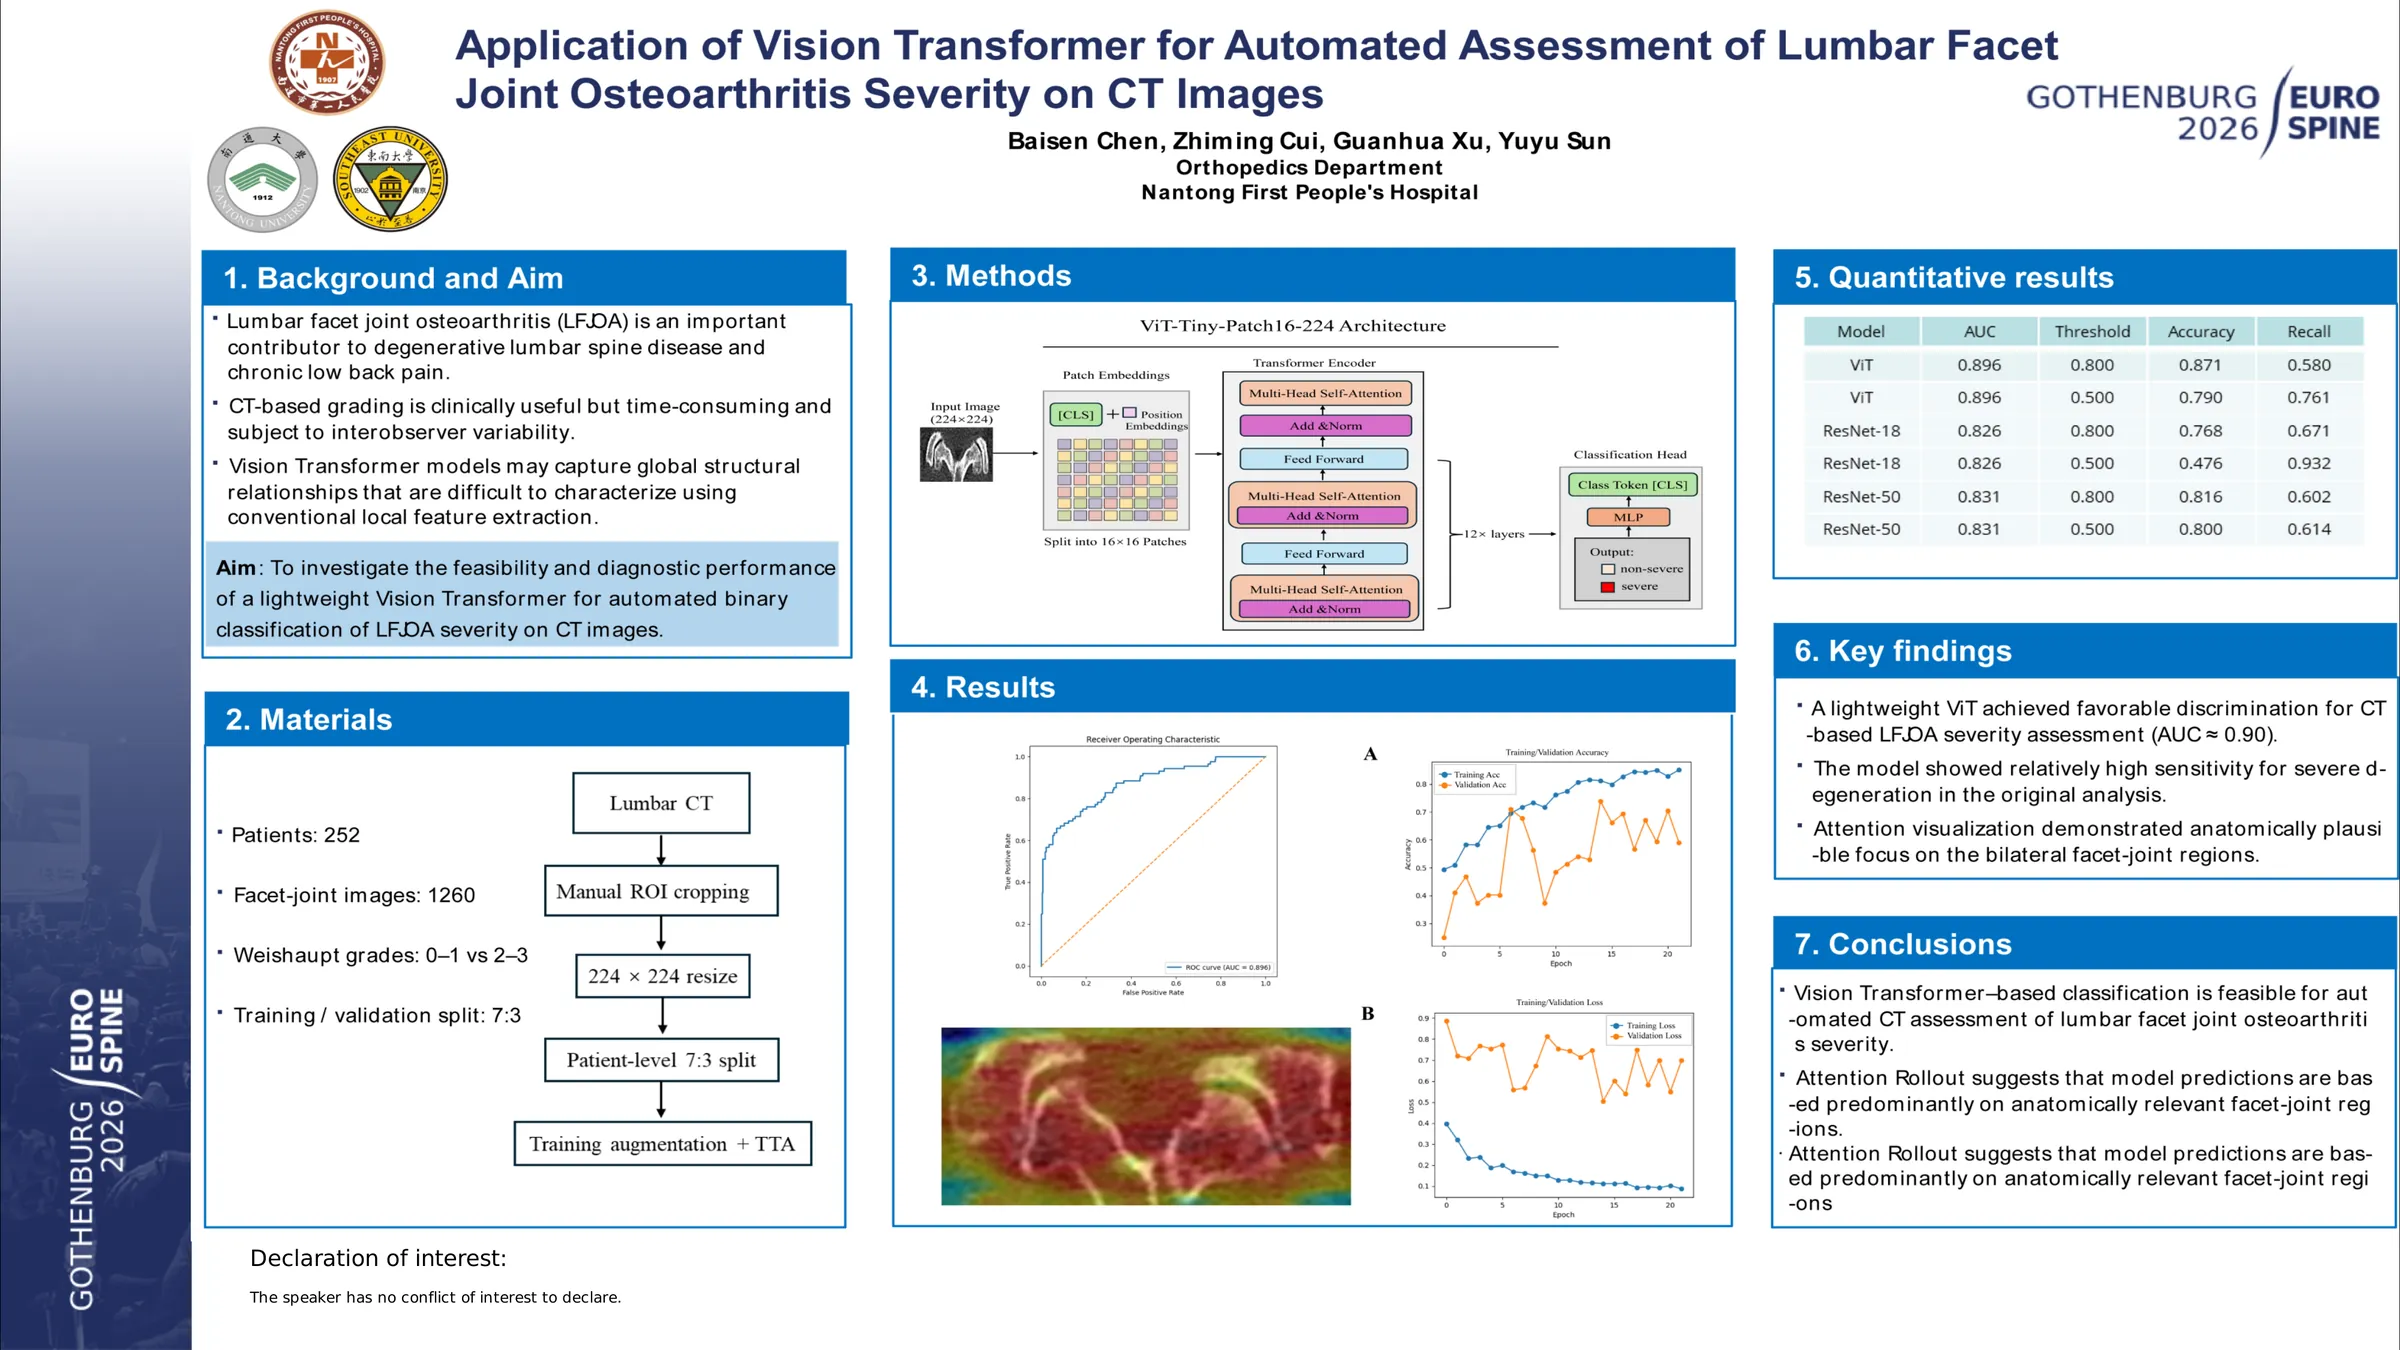
Lumbar facet joint osteoarthritis (LFJOA) is a major contributor to degenerative lumbar spine disease and is closely associated with chronic low back pain. Computed tomography (CT) plays an important role in evaluating facet joint degeneration; however, image interpretation is labor-intensive and subject to interobserver variability. Although convolutional neural network (CNN)-based approaches have shown promising results in medical image analysis, the application of Vision Transformer (ViT) models for LFJOA severity assessment remains underexplored. This study aimed to investigate the feasibility and diagnostic performance of a ViT-based model for binary classification of LFJOA severity on CT images.
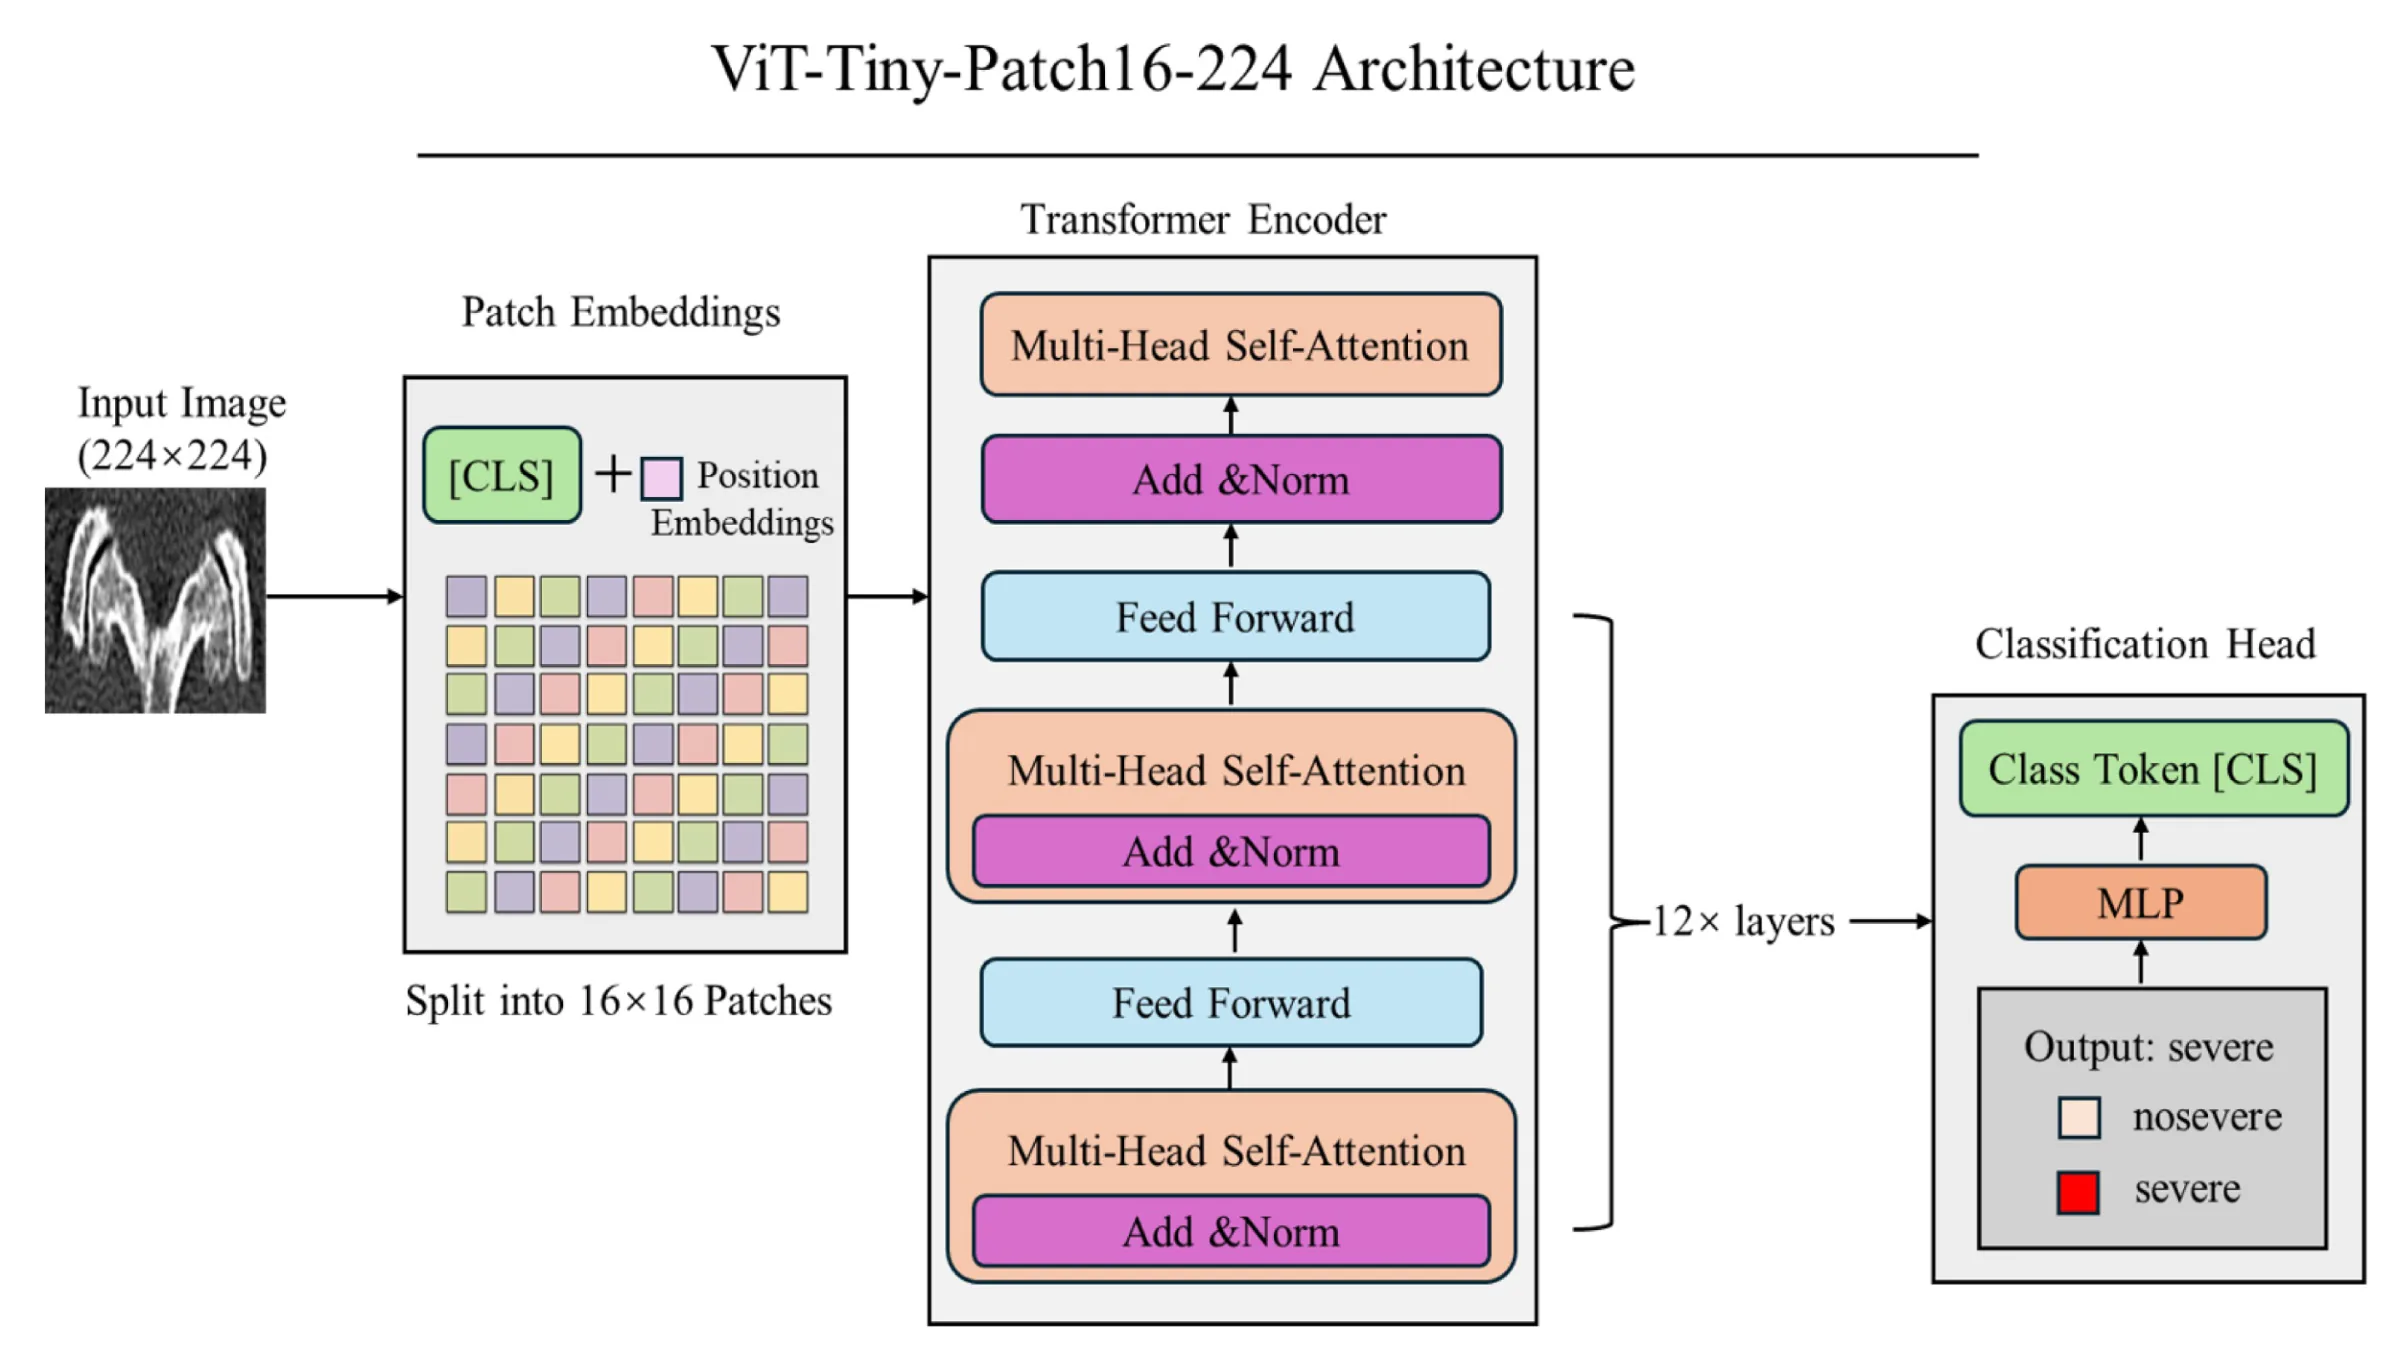
This retrospective study included CT images from 252 patients. Five facet joint images were extracted per patient, yielding a total of 1,260 images. Facet joint degeneration was graded according to the Weishaupt classification and dichotomized into non-severe (grades 0–1) and severe (grades 2–3) groups. A lightweight ViT-Tiny-Patch16-224 architecture was implemented for model training. To address class imbalance, focal loss, data augmentation, and class-balanced sampling were applied. Early stopping and test-time augmentation (TTA) were employed to improve generalization performance. Model interpretability was evaluated using the Attention Rollout method to visualize attention distribution.
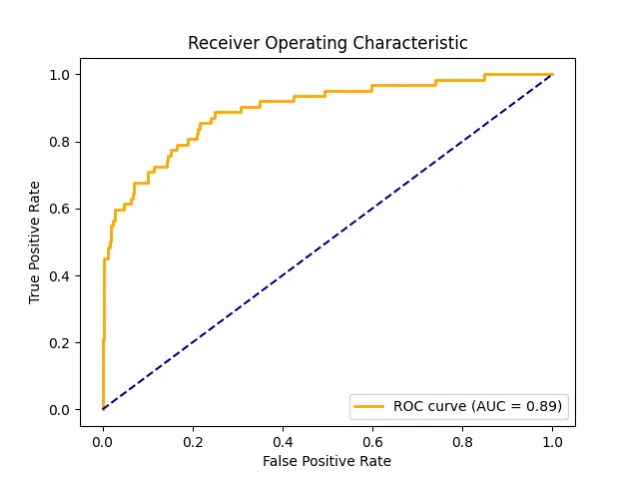
On the independent test set, the ViT model achieved an area under the receiver operating characteristic curve (AUC) of 0.90, with an accuracy of 59% and an F1-score of 0.55. The model demonstrated relatively high sensitivity in detecting severe degeneration cases. Attention visualization indicated that the model predominantly focused on anatomically relevant facet joint regions, showing consistency with radiological assessment patterns.
The proposed ViT-based framework demonstrated favorable discriminative performance and interpretability for automated assessment of LFJOA severity on CT images. This approach may serve as a potential clinical decision support tool and facilitate high-throughput image-based screening in degenerative lumbar spine evaluation.
Figures and tables
As submitted with the abstract. Tap a figure to open it at full size.