
Degenerative Thoracolumbar
Age-referenced facet joint degeneration is associated with chronic low back pain whereas absolute grades are not: a population-based normative modeling study
- Charité – Universitätsmedizin Berlin, Berlin, Germany
- Julius Wolff Institute for Biomechanics and Musculoskeletal Regeneration, Berlin, Germany
Abstract
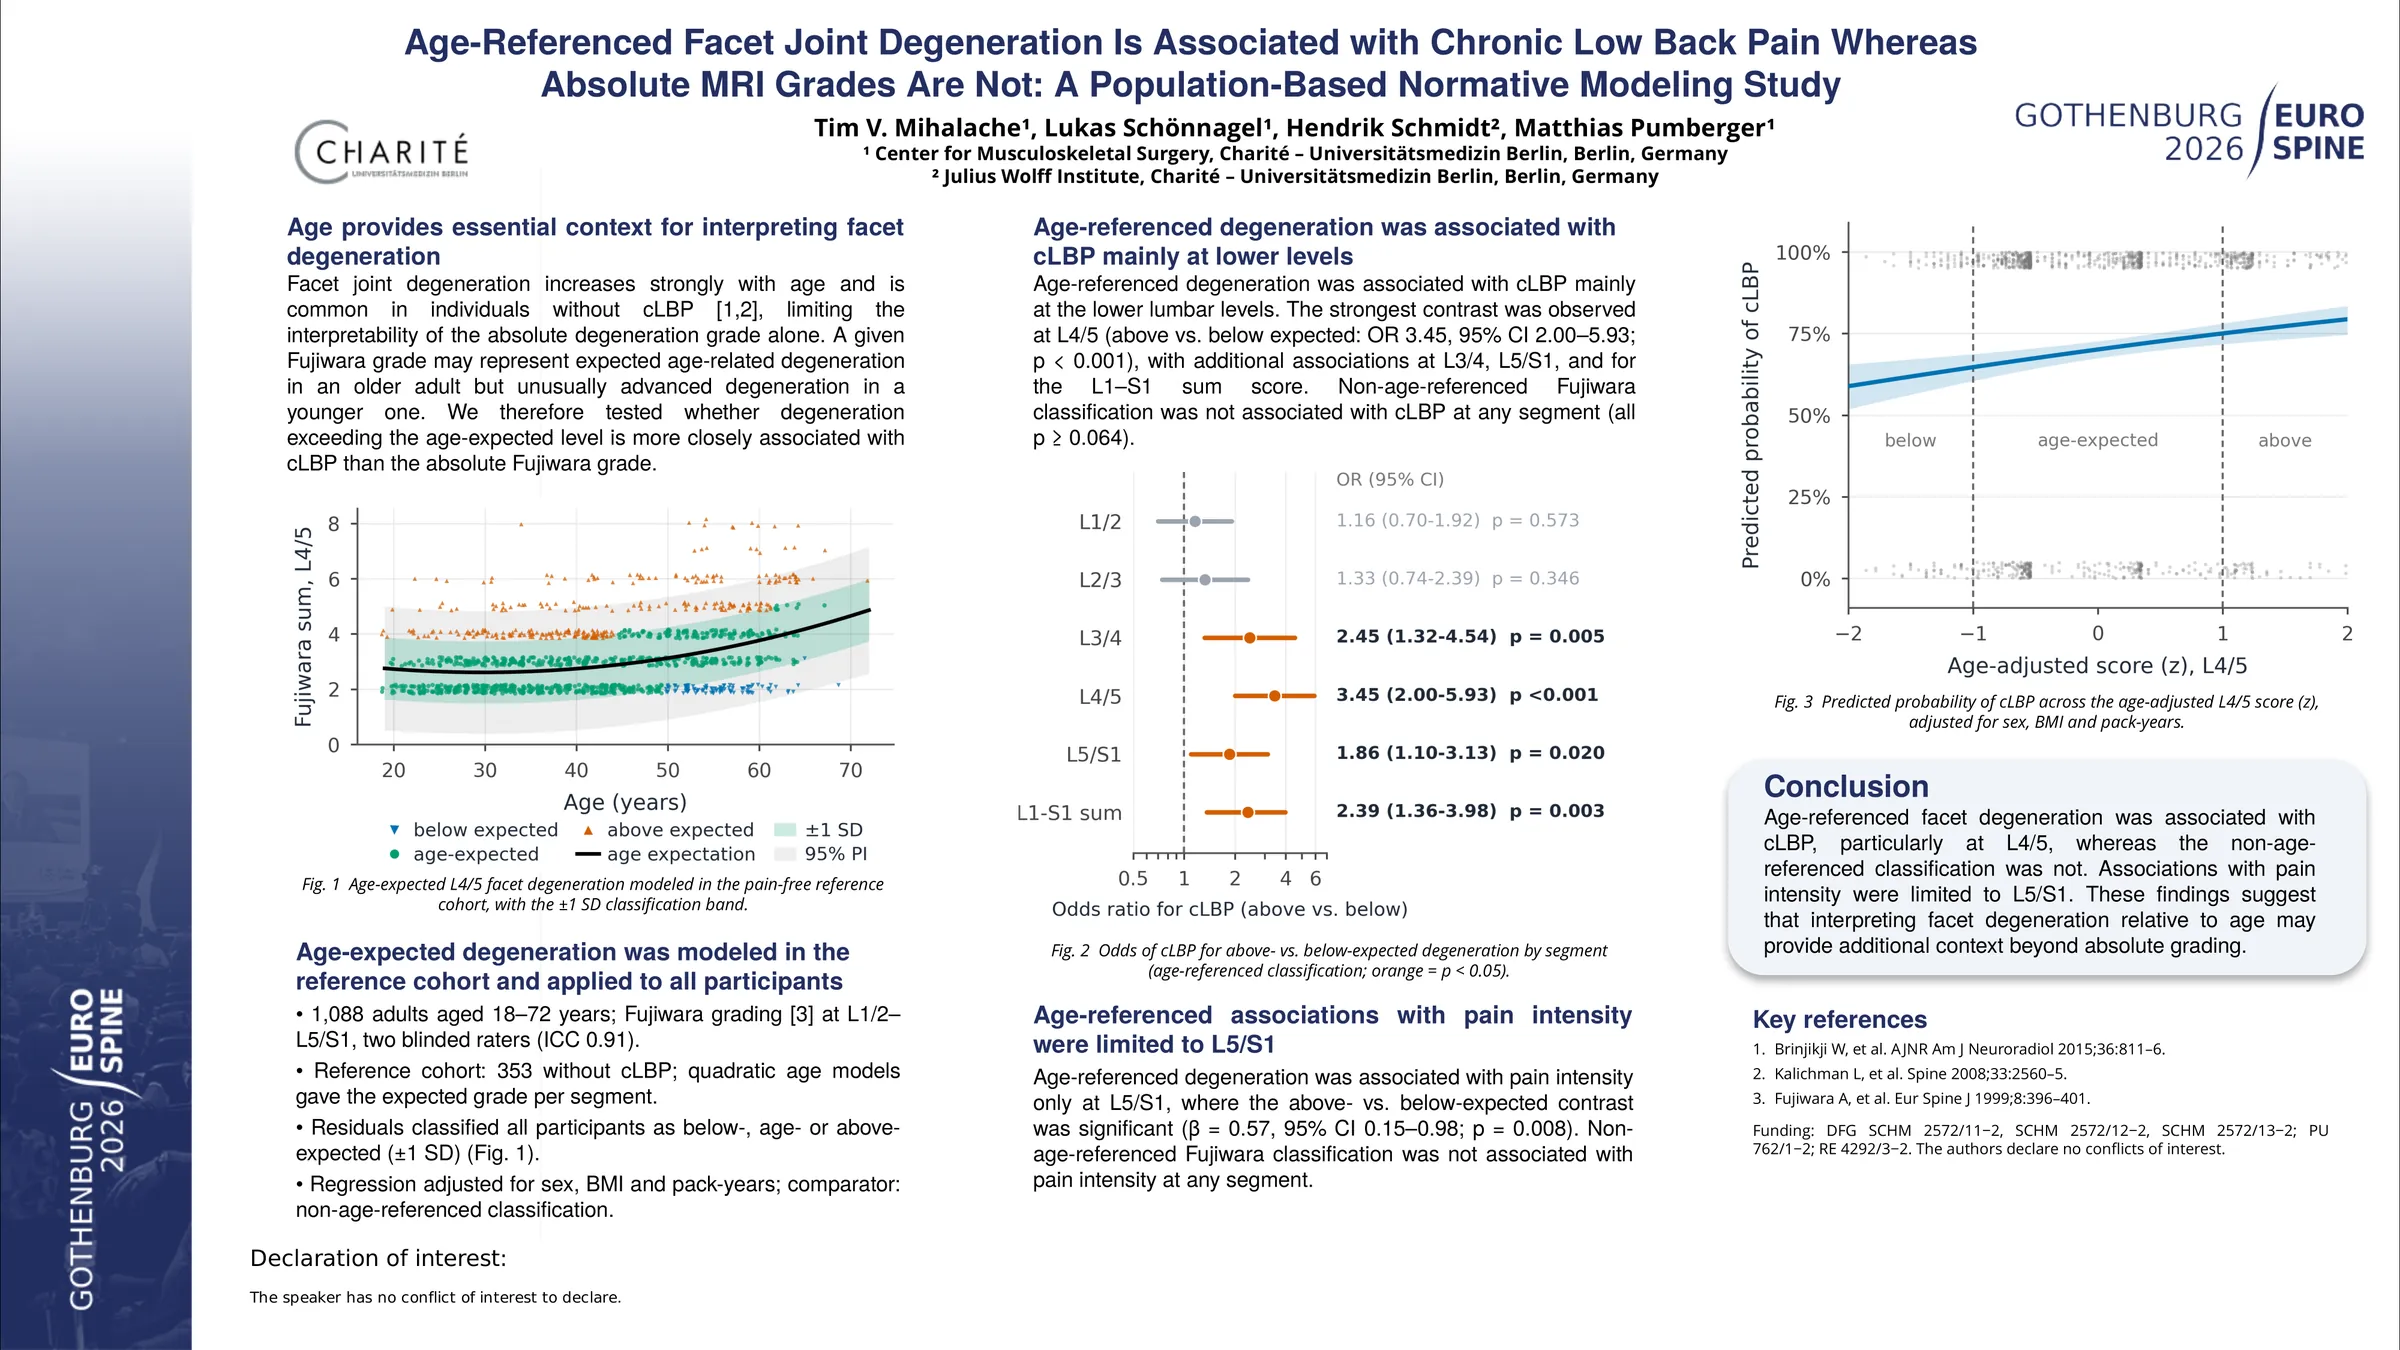
Facet joint degeneration is strongly age-dependent and common even in asymptomatic adults, limiting the clinical interpretability of absolute degeneration grades. We derived level-specific age-expected facet joint degeneration equations and tested whether age-inappropriate degeneration is associated with chronic low back pain (cLBP) and pain intensity.
This cross-sectional analysis included 1,088 participants (18–72 years) from a population based study. Facet degeneration was evaluated on standardized MRI using Fujiwara classification at levels L1/2–L5/S1. In the asymptomatic reference cohort (n = 353), segment-specific age-expected degeneration was modelled to obtain normative values. Individual deviation from the age-expected trajectory was quantified using standardized residuals and categorized as below-expected, age-expected, or above-expected (±1 SD) (Fig. 1). As a comparator, we additionally classified absolute non-age-adjusted Fujiwara grades based on reference distribution (±1 SD). Associations with cLBP were evaluated using multivariable logistic regression, whereas pain intensity was analyzed using multivariable linear regression; both models were adjusted for sex, BMI, and pack-years.
Age-adjusted residual-based classification revealed significant associations with cLBP, strongest at L4/5 (above vs below OR 3.45, 95% CI 2.00–5.93; p < 0.001; Fig. 2). Significant extreme-group contrasts were also observed at L5/S1 (OR 1.86, 95% CI 1.10–3.13; p = 0.020) and for the L1–S1 sum score (OR 2.39, 95% CI 1.36–3.98; p = 0.003). Associations with pain intensity were only significant at L5/S1 (above vs. below β = 0.57 (0.15–0.98); p = 0.008). In contrast, the comparator model using non age-adjusted Fujiwara values showed no significant associations with cLBP or pain intensity at any lumbar level.
This study establishes novel age-referenced normative equations for lumbar facet joint degeneration on routine MRI. Classifying degeneration according to deviation from age-expected trajectories identified significant and segment-specific associations with cLBP, whereas absolute grade classification showed none. Age-referenced interpretation may therefore enhance the clinical relevance of degenerative MRI findings, enable more standardized reporting of facet joint degeneration across age groups, and provide a basis for individualized risk stratification and targeted prevention.
Figures and tables
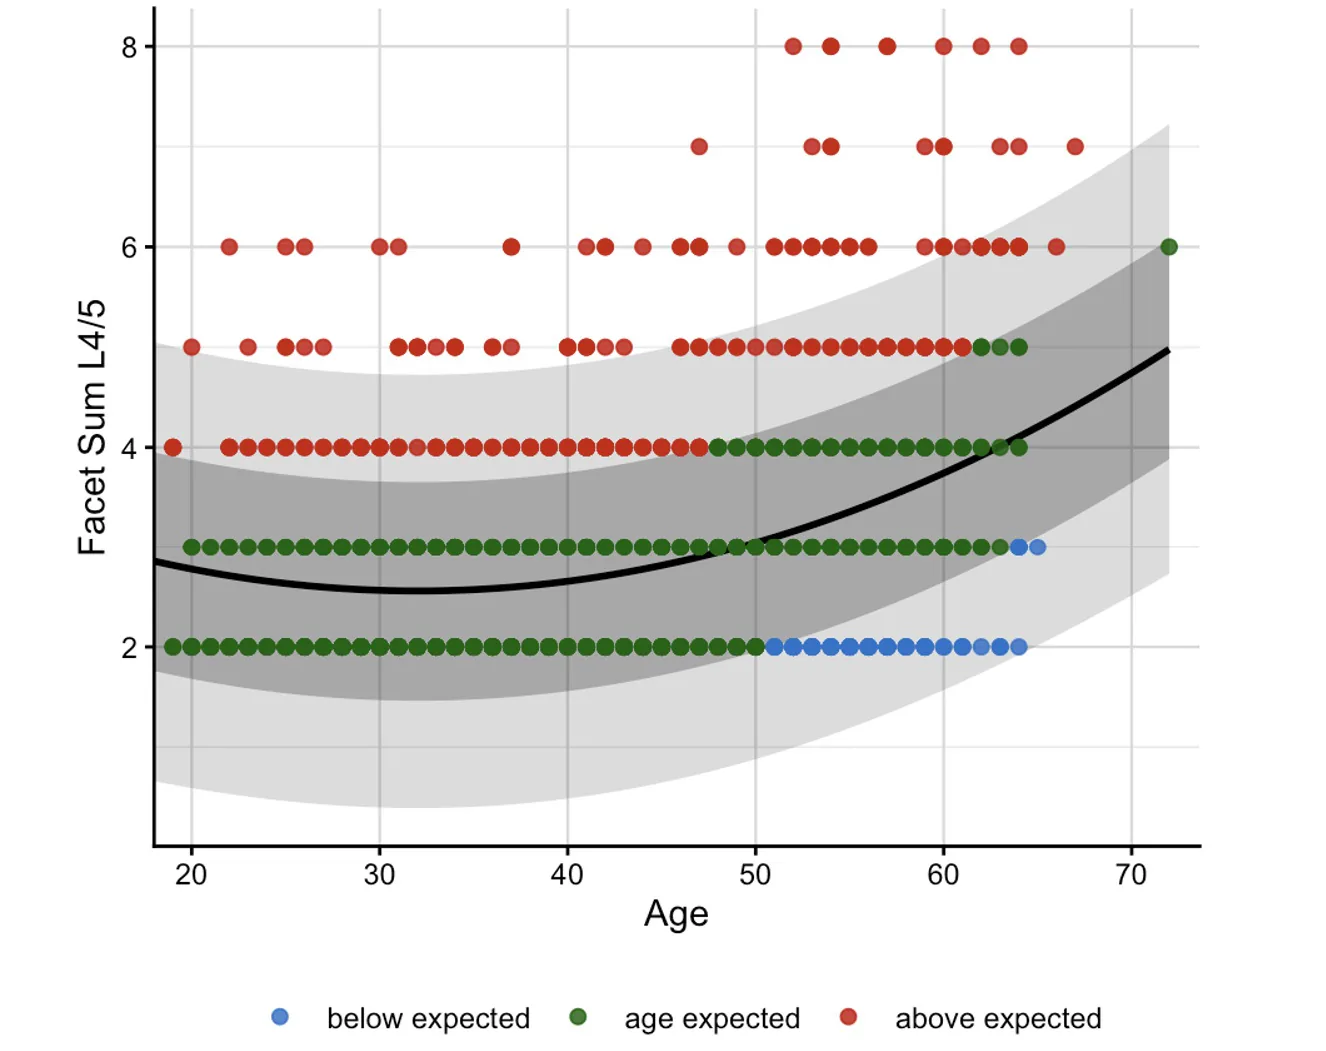
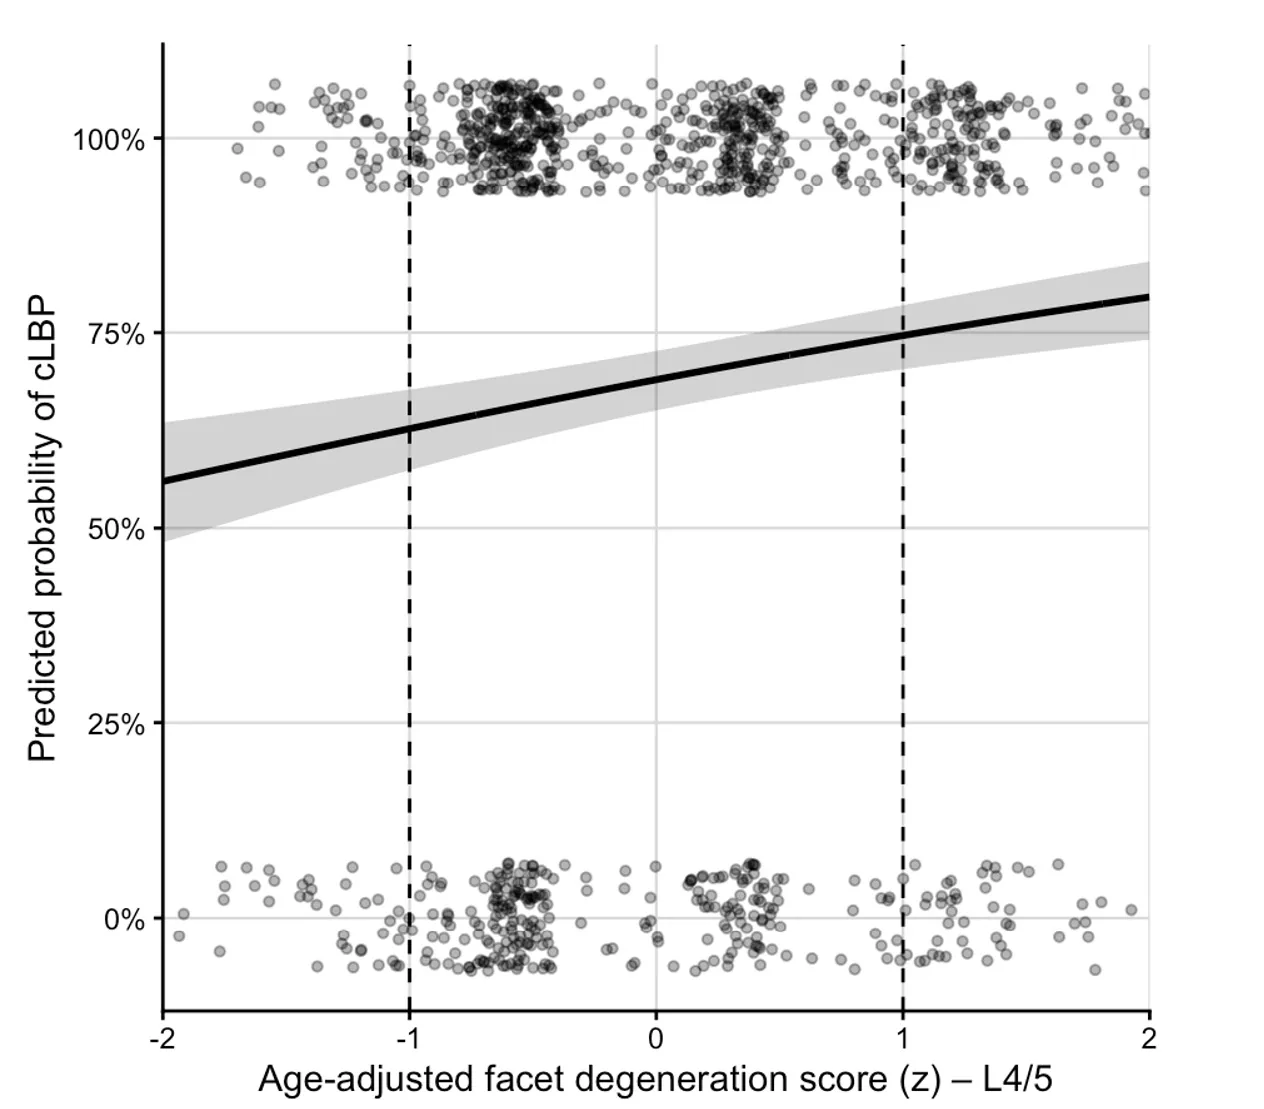
As submitted with the abstract. Tap a figure to open it at full size.