
Growing Spine
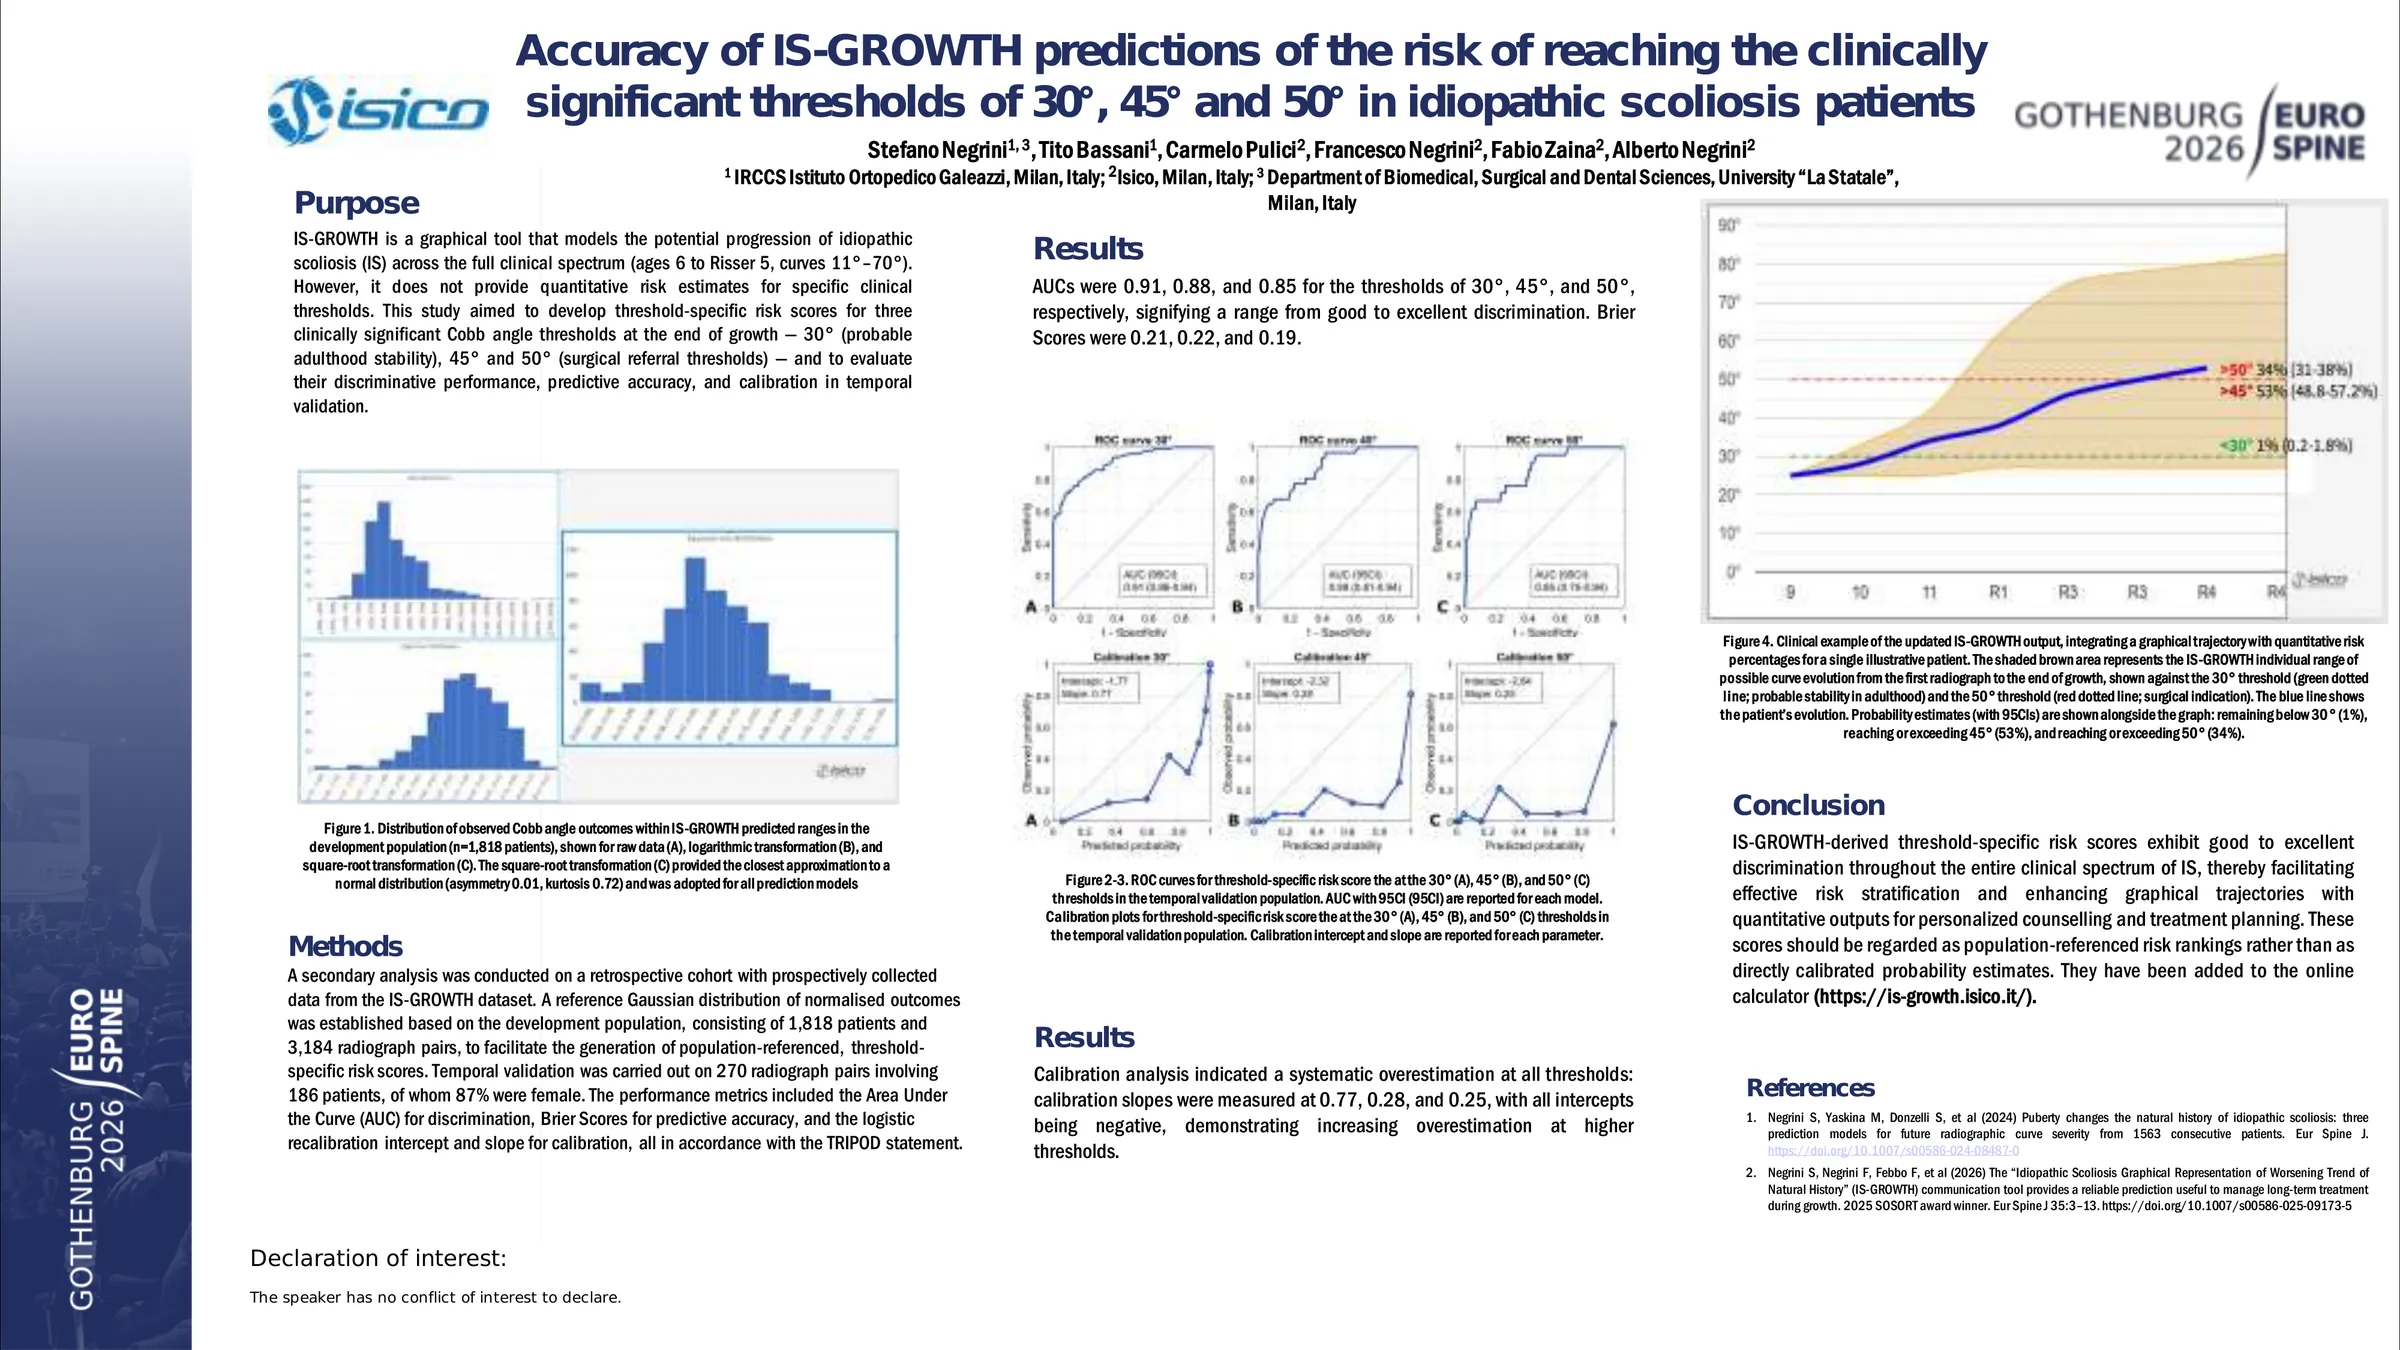
Accuracy of IS-GROWTH predictions of the risk of reaching the clinically significant thresholds of 30°, 45° and 50° in idiopathic scoliosis patients
- Università degli studi di Milano, milano, Italy
- IRCCS Istituto Ortopedico Galeazzi, Milan, Italy
- ISICO, Milan, Italy
- University of Insubria, Varese, Italy, milano, Italy
Abstract
IS-GROWTH has recently been developed to predict the progression of Idiopathic Scoliosis (IS) at allages, with curves up to 70° at start. While it provides a graphical representation of the wide range ofpossible evolutions, IS-GROWTH does not offer risk thresholds, unlike the previously developed BrAISTCalc(applicable only to adolescents IS curves 20-40°, Risser 0-2). The objective is to develop IS-GROWTH predictive formulae for the risk of reaching significant clinical thresholds at theend of growth: 30° for probable stability in adulthood; 45° and 50° for surgical indications
We considered the two groups (development and temporal validation) from the previously published ISGROWTHpaper, which included all available IS children who presented to our institute with prior X-raystaken before any treatment. We examined the distribution within the individually predicted ranges in thevalidation group. We applied a mathematical transformation to approximate a normal distribution andassessed normality using the Asymmetry and Kurtosis tests. We developed prediction models for the 30°, 45°, and 50° thresholds. We performed temporalvalidation on all radiograph pairs. We assessed performance using the Area Under the Curve (AUC) for discrimination, the accuracy of risk estimates through Brier Scores (BS) with 95% Confidence Intervals (95CI), and calibration analysis using risk deciles to compare predictedprobabilities with observed outcomes.
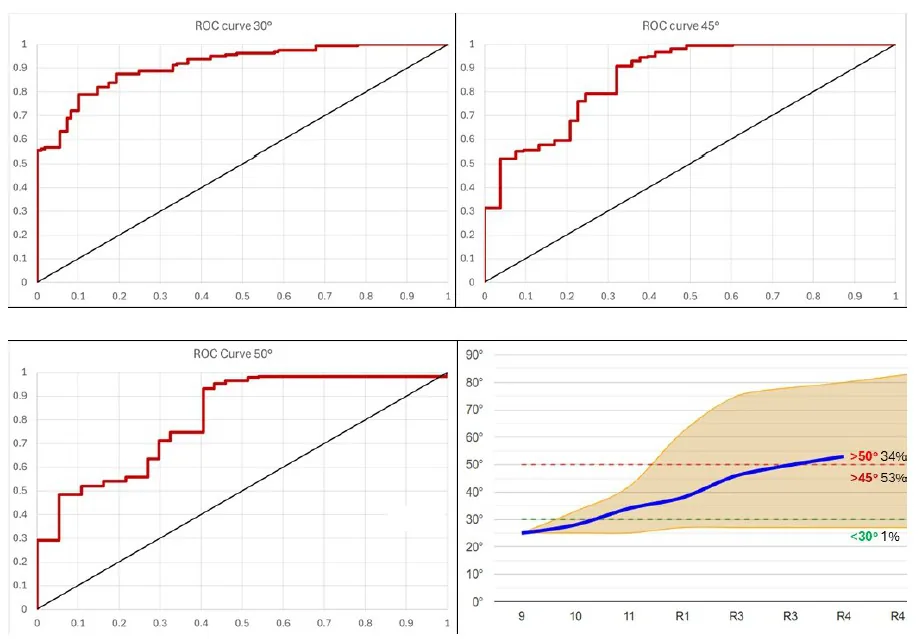
We evaluated the distribution of IS-GROWTH predictions for 552 patients (74% female, 12.4±2.0 and14.7±1.7 years, 19±9° and 26±11° at start and end, respectively). A square-root transformation providedthe best approximation to a normal distribution (asymmetry 0.01, kurtosis 0.72). To temporally validatethe prediction model, we had 270 pairs of radiographs (187 patients; 87% female; first radiograph belowage 10 for 17, and above age 10 at Risser 0, 1, 2, and 3 for 80, 31, 56, and 86, respectively). At the end ofgrowth, we had 109 radiographs <30°, and 53 and 37 >45° and 50°, respectively. The AUC (95CI) were0.91 (0.87-0.95), 0.86 (0.80-0.93) and 0.81 (0.72-0.90) for the 30°, 45° and 50° thresholds, respectively.Overall predictive accuracy was high, with Brier Scores of 0.19 (0.15-0.22) for 30°, 0.15 (0.12-0.18) for45°, and 0.14 (0.11-0.17) for 50°. Calibration analysis showed a strong correlation between predicted andobserved risks across all thresholds, with high reliability even at the probability extremes for surgicalindications.
IS-GROWTH provides accurate, validated probabilities for reaching clinically significant thresholds. Complementing graphical trajectories with quantitative risk estimates offers a more comprehensive prognostic tool than existing models, applicable to a wider clinical population. These validated risk percentages allow for personalised counselling and shared decision-making.
Figures and tables
As submitted with the abstract. Tap a figure to open it at full size.